- 2Dプロット
- 3Dプロット
- mayaviを使う。mayaviというのは、もともと(?)pythonで作ったアプリのことで、それがここからとれる
- いわゆる、pythonを書きながら使いましょう、という場合は、パッケージを取ってこないといけないのだけれど、その一つ
- mayaviを入れるには、ETS(Enthought Tool Suite)という、「色々入っていて便利なセット」を入れるのがよい
- python(x,y)のインストールにあたっては、インストール途中で、選択画面が出るので、そこで、デフォルトには入っていないETS,Sympy,Cythonなどを追加で入れるとよい
- こちらに"Under Window the best way to install Mayavi is to install a full Python distribution, such as EPD or Pythonxy. Note that for Pythonxy, you need to check in ‘ETS’ in the installer, when selecting components. If you want to reduce the disk used by the Pythonxy, you can uncheck other components."と書いてある通り
- そのうえで、python(x,y)のSpyderでmayaviを立ち上げるには、Spyderを立ち上げ、ツールバーから、Preferences->Console->External Modules->Enthought Tool Suite->ETS_TOOLKITと進んで、デフォルト設定であるqt4をwxに変える
- こちらに"I have a solution for now (I am not sure of it as a "fix"). I modified the following setting in Tools->Preferences->Console->External Modules->Enthought Tool Suite->ETS_TOOLKIT: change from Qt4 to wx. After changing this setting, I am able to execute code with Mayavi library and Mayavi plots directly from within Spyder."とあるように。
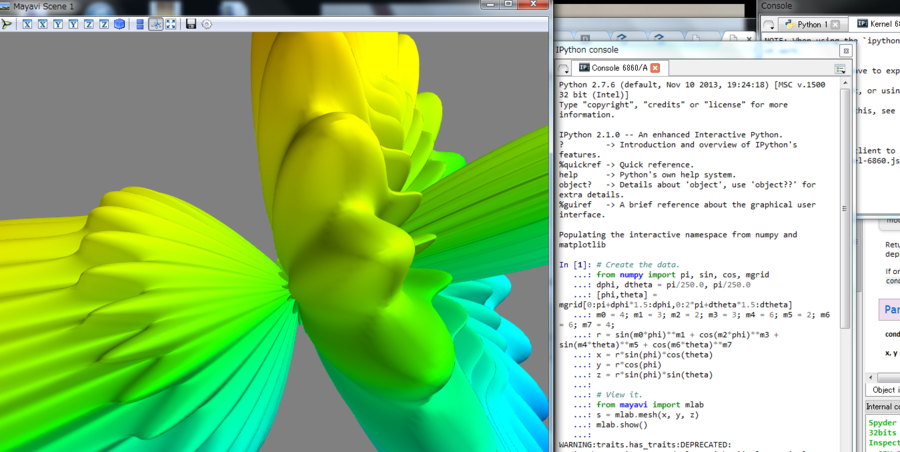
- こちらにある、mayaviのデモコードを実行してみる

# Create the data.
from numpy import pi, sin, cos, mgrid
dphi, dtheta = pi/250.0, pi/250.0
[phi,theta] = mgrid[0:pi+dphi*1.5:dphi,0:2*pi+dtheta*1.5:dtheta]
m0 = 4; m1 = 3; m2 = 2; m3 = 3; m4 = 6; m5 = 2; m6 = 6; m7 = 4;
r = sin(m0*phi)**m1 + cos(m2*phi)**m3 + sin(m4*theta)**m5 + cos(m6*theta)**m7
x = r*sin(phi)*cos(theta)
y = r*cos(phi)
z = r*sin(phi)*sin(theta)

# View it.
from mayavi import mlab
s = mlab.mesh(x, y, z)
mlab.show()
-
- Ipythonをコンソールから直接立ち上げるなら、"ipython"と打って開始すればよい("ipython --gui=wx"とせよ、というのも見つけたが、そうでもなさそう)
- ここまで設定ができていれば、こちらのサンプルなどはコピーペーストで動く
