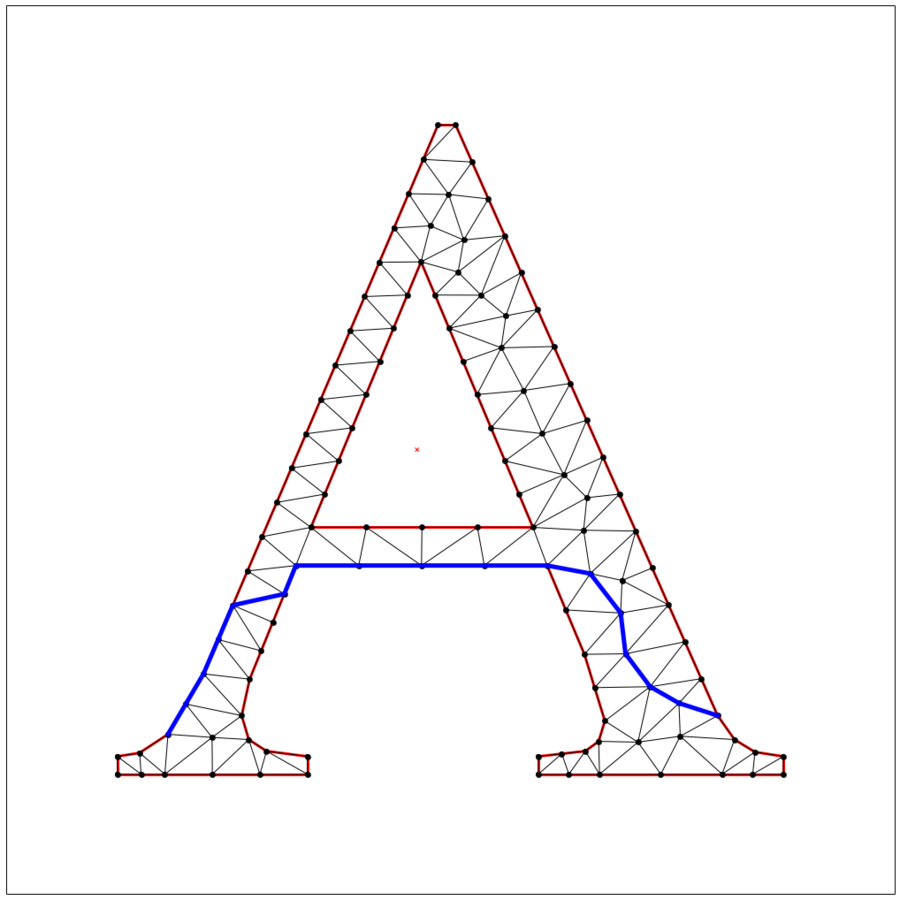
from sympy.geometry import *

P1 = Point(0, 0)
P2 = Point(3, 4)
P3 = Point(2, -1)
P4 = Point(-1, 5)

S1 = Segment(P1, P2)
S2 = Segment(P3, P4)
help(sympy)
Help on package sympy:

NAME
    sympy

FILE
    c:\python27\lib\site-packages\sympy\__init__.py

DESCRIPTION
    SymPy is a Python library for symbolic mathematics. It aims to become a
    full-featured computer algebra system (CAS) while keeping the code as
    simple as possible in order to be comprehensible and easily extensible.
    SymPy is written entirely in Python and does not require any external
    libraries, except optionally for plotting support.

    See the webpage for more information and documentation:

        http://code.google.com/p/sympy/

PACKAGE CONTENTS
    abc
    assumptions (package)
    calculus (package)
    ...
-
- わかったこと
- ローカルの"c:\python27\lib\site-packages\sympy\__init__.py"にファイルが置いてあって、その中に、ヘルプで表示される文章の一部が記載されていること
- ウェブサイトのURLがあること
- Package contents, Submodules, Dataという3タイプに属する色々が定義されていること
- "sympy.geometry"にもヘルプが効く
help(sympy.geometry)
Help on package sympy.geometry in sympy:

NAME
    sympy.geometry

FILE
    c:\python27\lib\site-packages\sympy\geometry\__init__.py

DESCRIPTION
    A geometry module for the SymPy library. This module contains all of the
    entities and functions needed to construct basic geometrical data and to
    perform simple informational queries.
...
- 作ったオブジェクトについて調べる
- "sympy.geometry.point.Point"というクラスとわかる
P4.__class__
Out[79]: sympy.geometry.point.Point
print(P4.__doc__)
A point in a 2-dimensional Euclidean space.

    Parameters
    ==========

    coords : sequence of 2 coordinate values.

    Attributes
    ==========

    x
    y
    length

    Raises
    ======

    NotImplementedError
        When trying to create a point with more than two dimensions.
        When `intersection` is called with object other than a Point.
    TypeError
        When trying to add or subtract points with different dimensions.

    Notes
    =====

    Currently only 2-dimensional points are supported.

    See Also
    ========

    sympy.geometry.line.Segment : Connects two Points

    Examples
    ========

    >>> from sympy.geometry import Point
    >>> from sympy.abc import x
    >>> Point(1, 2)
    Point(1, 2)
    >>> Point([1, 2])
    Point(1, 2)
    >>> Point(0, x)
    Point(0, x)

    Floats are automatically converted to Rational unless the
    evaluate flag is False:

    >>> Point(0.5, 0.25)
    Point(1/2, 1/4)
    >>> Point(0.5, 0.25, evaluate=False)
    Point(0.5, 0.25)
-
- "Attribute"というのがあるので、P4のそれを取り出してみる
P4.x # 点P4のx座標
Out[86]: -1
- クラス"sympy.geometry.point.Point"の中の"sympy.geometry.point"というのが何かを調べてみる
- モジュールであることがわかる。
- 中には"Point"というもの、一つ、がContainsされていることがわかる
help(sympy.geometry.point)
Help on module sympy.geometry.point in sympy.geometry:

NAME
    sympy.geometry.point - Geometrical Points.

FILE
    c:\python27\lib\site-packages\sympy\geometry\point.py

DESCRIPTION
    Contains
    ========
    Point
- ここまでで、sympyパッケージの中にあるsympy.geometryという(サブ)パッケージを使っていて、その中に、pointについて書いたモジュールがあって、それをPoint()関数で作ることがわかった
- ここまでわかると、以下は、そのようなPointを二つ引数としてとる関数Segment()がS1を作っていることがわかるので、念のためS1についても調べ物をしてみる
S1 = Segment(P1, P2)
S1.__class__
Out[89]: sympy.geometry.line.Segment
print(S1.__doc__)
A undirected line segment in space.

    Parameters
    ==========

    p1 : Point
    p2 : Point

    Attributes
    ==========

    length : number or sympy expression
    midpoint : Point
...
S1.midpoint
Out[94]: Point(3/2, 2)

S1.length
Out[95]: 5
-
- 中点(midpoint)のx座標が、3/2となっていて、1.5でない。このあたりが代数パッケージsympyの本領発揮か…(幾何では、下手に少数扱いすると、「点の一致」の証明などが難しくなることを反映しているのだろう。幾何アプリが複素数ベースになっている(シンデレラとか)ことにつながる話
- チュートリアルの次のコマンドを調べてみる
Point.is_collinear(P1, P2, P3)
help(sympy.geometry.Point.is_collinear)
Help on method is_collinear in module sympy.geometry.point:

is_collinear(*points) unbound sympy.geometry.point.Point method
    Is a sequence of points collinear?

    Test whether or not a set of points are collinear. Returns True if
    the set of points are collinear, or False otherwise.

    Parameters
    ==========

    points : sequence of Point

    Returns
    =======

    is_collinear : boolean

    Notes
    =====

    Slope is preserved everywhere on a line, so the slope between
    any two points on the line should be the same. Take the first
    two points, p1 and p2, and create a translated point v1
S1.intersection(S2)
help(sympy.geometry.Segment.intersection)
Help on method intersection in module sympy.geometry.line:

intersection(self, o) unbound sympy.geometry.line.Segment method
    The intersection with another geometrical entity.

    Parameters
    ==========

    o : Point or LinearEntity
- この調子で点、線分、直線、円、曲線などの使い方が示される(もう、なぞらなくても、わかる)
- さて、いよいよ、本番の、「二次元の形のボロノイ図的扱い」
- このサイトではスペリオル湖の例を扱っているのだが、残念ながら、そのファイルへのアクセスが切れているので、こちらのa.zipファイルをダウンロード・解凍して、得られる、"A.poly"ファイルを使おう
- ただし、そのファイルは2−30行目が、シングル・スペース区切りで4列になっているが、第4列目があると邪魔なので、それを削除して保存しなおした(以下を"A.poly"として保存して使えばOK)
29 2 1 0
1 0.200000 -0.776400
2 0.220000 -0.773200
3 0.245600 -0.756400
4 0.277600 -0.702000
5 0.488800 -0.207600
6 0.504800 -0.207600
7 0.740800 -0.739600
8 0.756000 -0.761200
9 0.774400 -0.772400
10 0.800000 -0.776400
11 0.800000 -0.792400
12 0.579200 -0.792400
13 0.579200 -0.776400
14 0.621600 -0.771600
15 0.633600 -0.762800
16 0.639200 -0.744400
17 0.620800 -0.684400
18 0.587200 -0.604400
19 0.360800 -0.604400
20 0.319200 -0.706800
21 0.312000 -0.739600
22 0.318400 -0.761200
23 0.334400 -0.771600
24 0.371200 -0.776400
25 0.371200 -0.792400
26 0.374400 -0.570000
27 0.574400 -0.570000
28 0.473600 -0.330800
29 0.200000 -0.792400
29 0
1 29 1
2 1 2
3 2 3
4 3 4
5 4 5
6 5 6
7 6 7
8 7 8
9 8 9
10 9 10
11 10 11
12 11 12
13 12 13
14 13 14
15 14 15
16 15 16
17 16 17
18 17 18
19 18 19
20 19 20
21 20 21
22 21 22
23 22 23
24 23 24
25 24 25
26 25 29
27 26 27
28 27 28
29 28 26
1
1 0.47 -0.5
- この"A.poly"ファイルをワーキング・ディレクトリに置いて、以下の関数 read_poly() を実行
from numpy import array

def read_poly(file_name):
    """
    Simple poly-file reader, that creates a python dictionary
    with information about vertices, edges and holes.
    It assumes that vertices have no attributes or boundary markers.
    It assumes that edges have no boundary markers.
    No regional attributes or area constraints are parsed.
    """

    output = {'vertices': None, 'holes': None, 'segments': None}

    # open file and store lines in a list
    file = open(file_name, 'r')
    lines = file.readlines()
    file.close()
    lines = [x.strip('\n').split() for x in lines]

    # Store vertices
    vertices= []
    N_vertices, dimension, attr, bdry_markers = [int(x) for x in lines[0]]
    # We assume attr = bdrt_markers = 0
    for k in range(N_vertices):
        label, x, y = [items for items in lines[k+1]]
        vertices.append([float(x), float(y)])
    output['vertices']=array(vertices)

    # Store segments
    segments = []
    N_segments, bdry_markers = [int(x) for x in lines[N_vertices+1]]
    for k in range(N_segments):
        label, pointer_1, pointer_2 = [items for items in lines[N_vertices+k+2]]
        segments.append([int(pointer_1)-1, int(pointer_2)-1])
    output['segments'] = array(segments)

    # Store holes
    N_holes = int(lines[N_segments+N_vertices+2][0])
    holes = []
    for k in range(N_holes):
        label, x, y = [items for items in lines[N_segments + N_vertices + 3 + k]]
        holes.append([float(x), float(y)])

    output['holes'] = array(holes)

    return output
import numpy as np
from scipy.spatial import ConvexHull
import matplotlib.pyplot as plt
%matplotlib inline
lake_superior = read_poly("A.poly") # この行をウェブサイトのコードから書き換え
vertices_ls = lake_superior['vertices']
- 2次元頂点座標リスト(点の数行x2列)ができている
vertices_ls.shape
Out[164]: (29, 2)
vertices_ls
Out[163]:
array([[ 0.2   , -0.7764],
       [ 0.22  , -0.7732],
       [ 0.2456, -0.7564],
       [ 0.2776, -0.702 ],
       [ 0.4888, -0.2076],
       [ 0.5048, -0.2076],
       [ 0.7408, -0.7396],
       [ 0.756 , -0.7612],
       [ 0.7744, -0.7724],
       [ 0.8   , -0.7764],
       [ 0.8   , -0.7924],
       [ 0.5792, -0.7924],
       [ 0.5792, -0.7764],
       [ 0.6216, -0.7716],
       [ 0.6336, -0.7628],
       [ 0.6392, -0.7444],
       [ 0.6208, -0.6844],
       [ 0.5872, -0.6044],
       [ 0.3608, -0.6044],
       [ 0.3192, -0.7068],
       [ 0.312 , -0.7396],
       [ 0.3184, -0.7612],
       [ 0.3344, -0.7716],
       [ 0.3712, -0.7764],
       [ 0.3712, -0.7924],
       [ 0.3744, -0.57  ],
       [ 0.5744, -0.57  ],
       [ 0.4736, -0.3308],
       [ 0.2   , -0.7924]])
- 重いかもしれない処理の処理時間計測をしながら実行する。全然時間がかからない(点の数が少ないからね…この例では)
%time hull = ConvexHull(vertices_ls)
Wall time: 0 ns
help(%time)
  File "<ipython-input-172-31570dae5c0e>", line 1
    help(%time)
         ^
SyntaxError: invalid syntax
- となって、help()ではだめなことがわかる。"python %time"とかdグーグル検索するとIPythonにあるマジックコマンド/%quickrefとよばれるものの一つだとわかる(こちら)
- 次のようにやると、一連のマジックコマンドが示される
%quickref
- また、hullというオブジェクトができている。何かしらConvexHull(凸包)の情報をしょっているはず、くらいの理解でも先に進める
- さて、点座標データから凸包を描いてみる
- "for simplex in hull.simplices"とあるので、hullのAttributesの一つにsimplicesというのがあって、それには、simplexとして取り出されるものが複数、入っているはず
plt.figure(figsize=(18, 18)) # 図のサイズ指定
plt.xlim(vertices_ls[:,0].min()-0.01, vertices_ls[:,0].max()+0.01) # x,y軸の範囲を存在点座標の範囲より0.01広げる
plt.ylim(vertices_ls[:,1].min()-0.01, vertices_ls[:,1].max()+0.01)
plt.axis('off')
plt.axes().set_aspect('equal') # x,y軸の長さを揃える
plt.plot(vertices_ls[:,0], vertices_ls[:,1], 'b.')
for simplex in hull.simplices: # hull.simplicesの要素(辺)を一つずつ描く
    plt.plot(vertices_ls[simplex, 0], vertices_ls[simplex, 1], 'r-')

plt.show()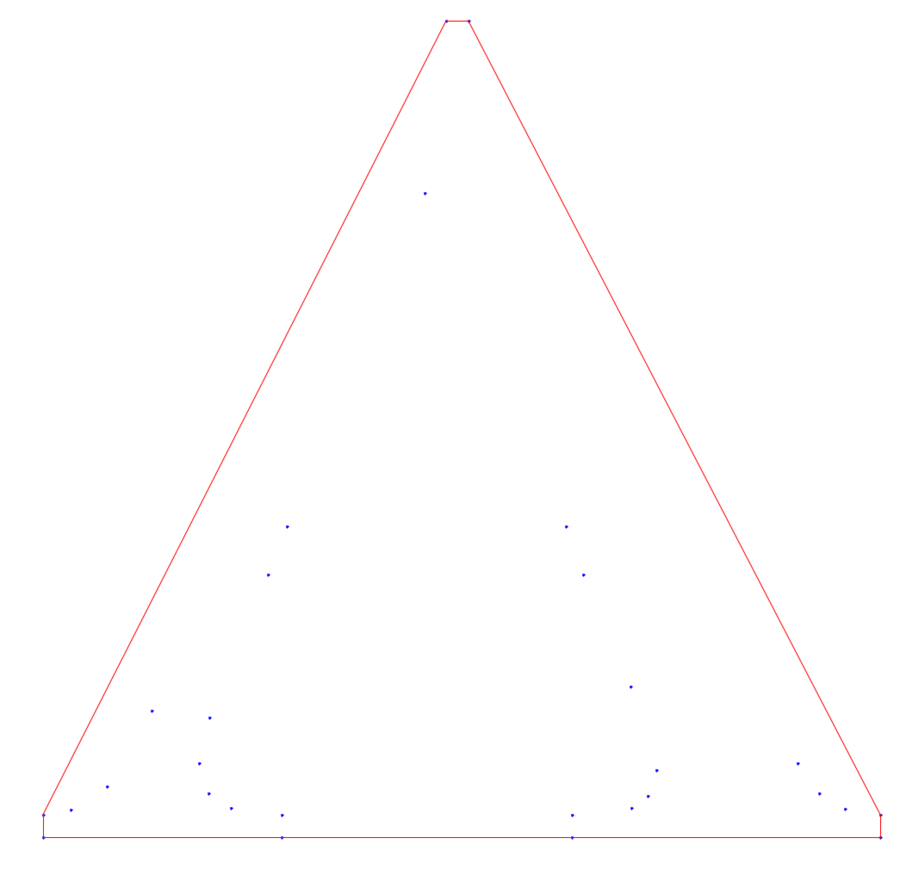
-
- hull.simplicesを見てみる。ただのアレイとわかる
hull.simplices.__class__
Out[178]: numpy.ndarray

hull.simplices.__doc__

hull.simplices
Out[180]:
array([[ 4,  0],
       [10,  9],
       [ 5,  9],
       [ 5,  4],
       [28,  0],
       [28, 10]])
- mayaviの3dプロットの例が挿入されている(スペルミスがあるので、直して、以下に書く
from mayavi import mlab

points = np.random.rand(320, 3)

hull = ConvexHull(points)

X = hull.points[:, 0]
Y = hull.points[:, 1]
Z = hull.points[:, 2]
# X,Y,Xとリンク先には書いてあったが、X,Y,Zにしておく
mlab.triangular_mesh(X, Y, Z, hull.simplices, colormap='gray', opacity=0.5, representation='wireframe')

mlab.show()

from scipy.spatial import Voronoi, voronoi_plot_2d
vor = Voronoi(vertices_ls)

plt.figure(figsize=(10, 10))
ax = plt.subplot(111, aspect='equal')
voronoi_plot_2d(vor, ax=ax)
plt.xlim(-0.5,1.5) # 範囲は、適当に描かれた絵を見たあとで調整使用
plt.ylim(-1.5,0.5)
plt.show()
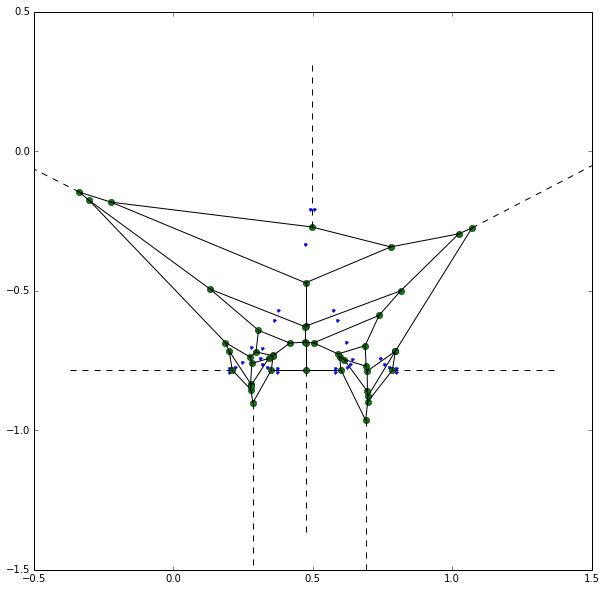
from scipy.spatial import Delaunay, delaunay_plot_2d

tri = Delaunay(vertices_ls)

plt.figure(figsize=(18, 18))
ax = plt.subplot(111, aspect='equal')
delaunay_plot_2d(tri, ax=ax)
plt.show()
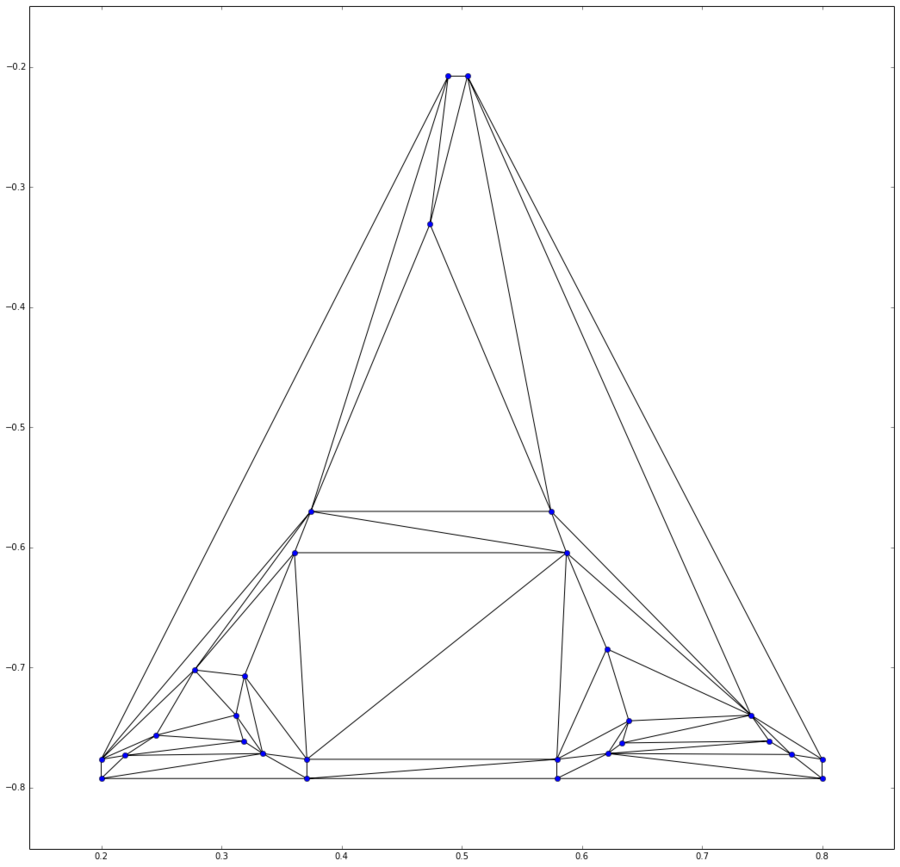
- さて、ここで、もっと素敵なtriangleパッケージを入れて、やり直しましょう!となる
- これはIpythonの中からOSのコマンドライン実行をしている
- こちらに「シェルコマンドが使える」で書かれている通り
!pip install triangle
-
- "pipコマンド"なわけだが、コンパイルでエラーが出た。「Unable to find vcvarsall.bat」というエラーが出て…。こちらにそれについての記載がある
- 結局、コンパイラの扱いがうまくいくようにするのが、よい、ということで、実は、Windowsがpython2.7を使いたい人のために、「よくできたコンパイラ」をこちらから提供していることがわかったので、これを入れることにする
- コンパイラをインストールした上で、Ipython内からシェル実行を以下のようにしてsetuptoolsをアップデートしておき、triangle パッケージを同じくpipでシェル実行する
!pip install -U setuptools
!pip install triangle
from triangle import triangulate, plot as tplot
cndt = triangulate(lake_superior, 'p')

plt.figure(figsize=(18, 18))
ax = plt.subplot(111, aspect='equal')
tplot.plot(ax, **cndt)
plt.show()
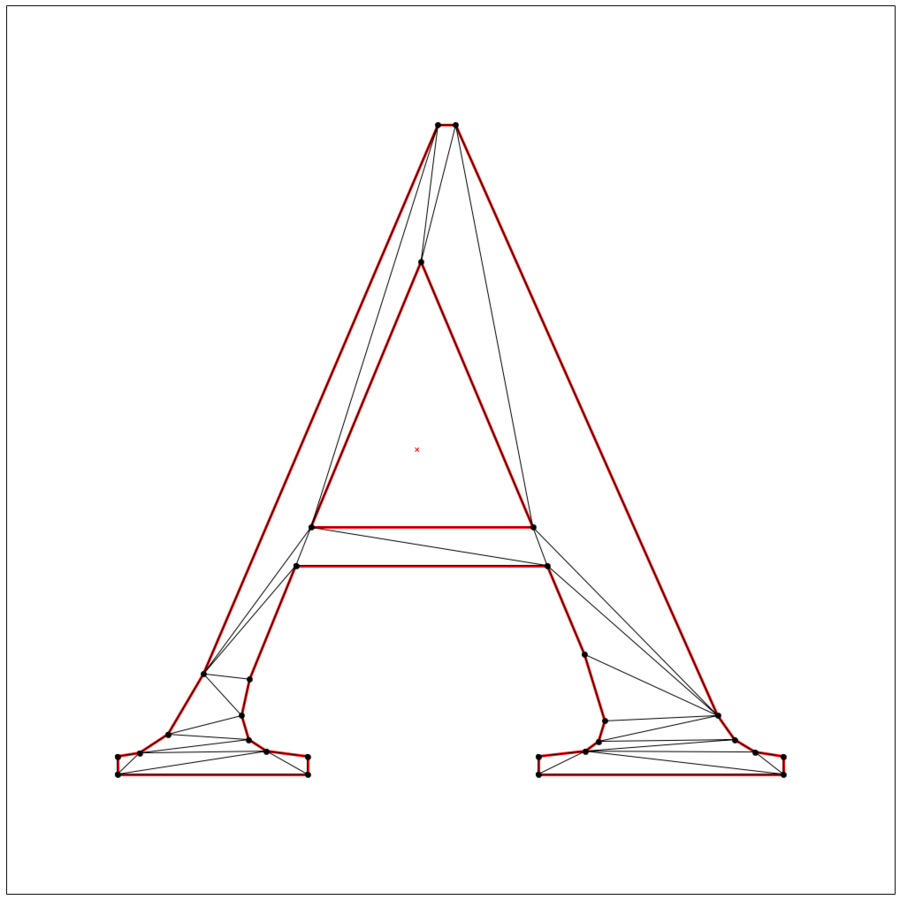
cfdt = triangulate(lake_superior, 'pD')

cncfq20dt = triangulate(lake_superior, 'pq20D')

plt.figure(figsize=(18,18))
ax = plt.subplot(111, aspect='equal')
tplot.plot(ax, **cncfq20dt)
plt.show()
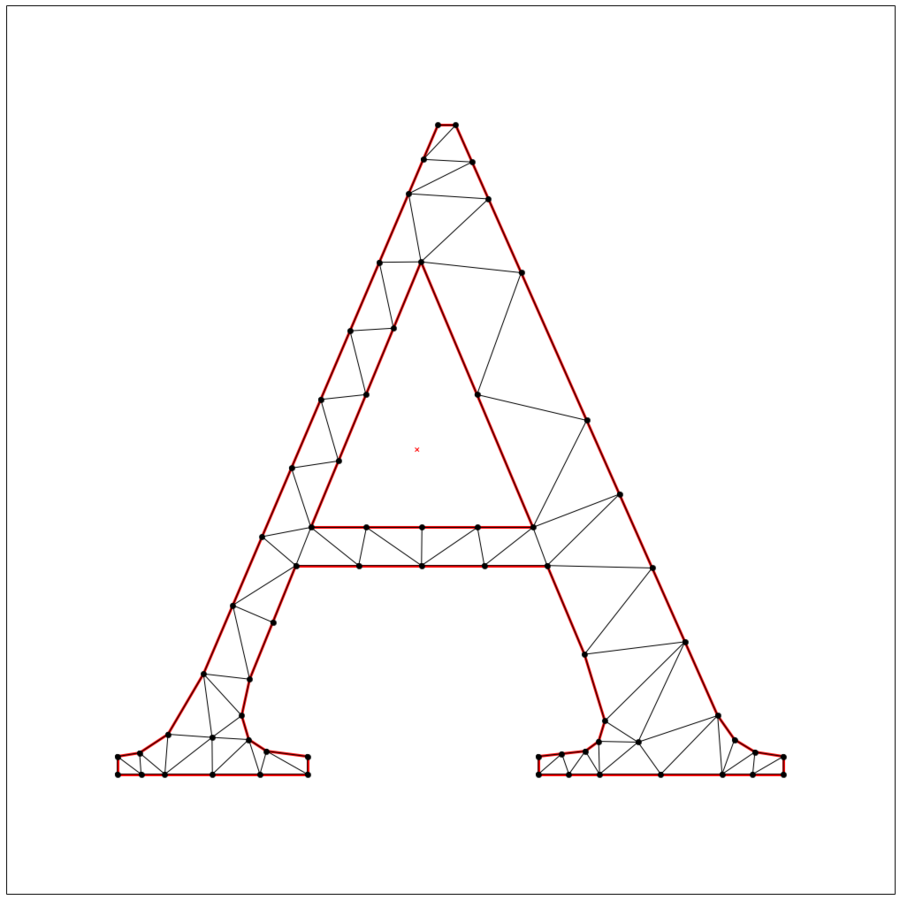
cncfq20adt = triangulate(lake_superior, 'pq20a.001D')

plt.figure(figsize=(18, 18))
ax = plt.subplot(111, aspect='equal')
tplot.plot(ax, **cncfq20adt)
plt.show()
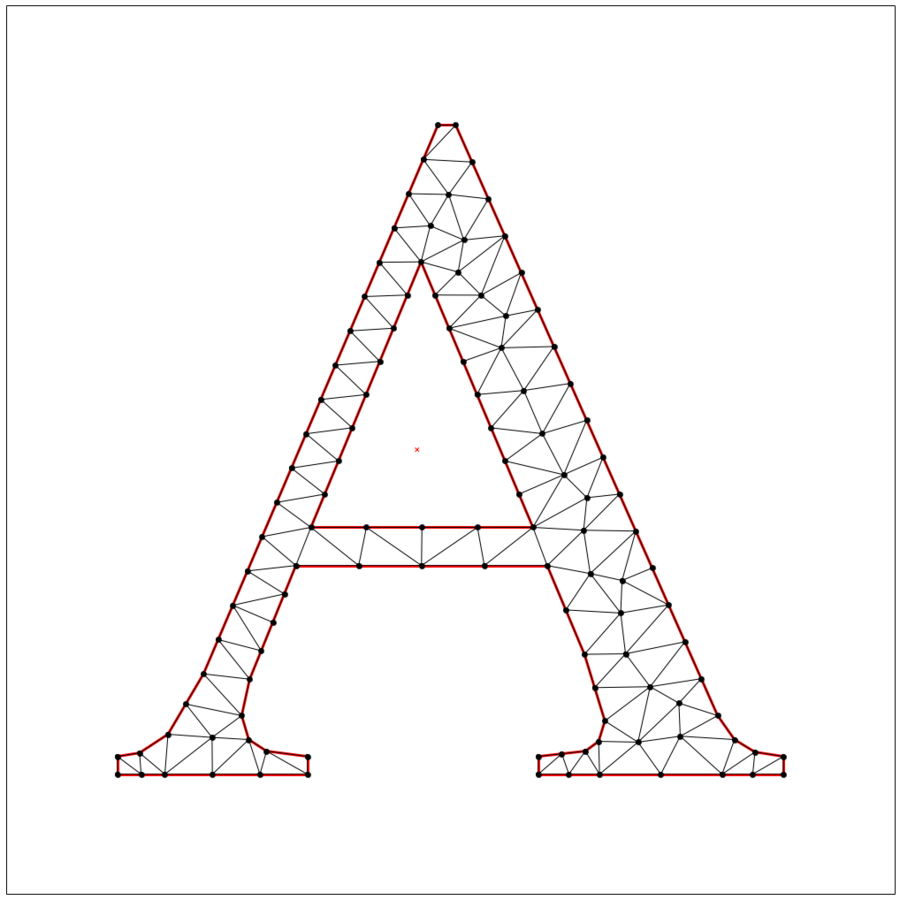
from scipy.spatial import minkowski_distance
X = cncfq20adt['triangles'][:,0]
Y = cncfq20adt['triangles'][:,1]
Z = cncfq20adt['triangles'][:,2]

Xvert = [cncfq20adt['vertices'][x] for x in X]
Yvert = [cncfq20adt['vertices'][y] for y in Y]
Zvert = [cncfq20adt['vertices'][z] for z in Z]

lengthsXY = minkowski_distance(Xvert, Yvert)
lengthsXZ = minkowski_distance(Xvert, Zvert)
lengthsYZ = minkowski_distance(Yvert, Zvert)

from scipy.sparse import lil_matrix
from scipy.sparse.csgraph import shortest_path
nvert = len(cncfq20adt['vertices'])
G = lil_matrix((nvert, nvert))
for k in range(len(X)):
    G[X[k], Y[k]] = G[Y[k], X[k]] = lengthsXY[k]
    G[X[k], Z[k]] = G[Z[k], X[k]] = lengthsXZ[k]
    G[Y[k], Z[k]] = G[Z[k], Y[k]] = lengthsYZ[k]
dist_matrix, pred = shortest_path(G, return_predecessors=True, directed=True, unweighted=False)
index = 2 # ウェブサイトで使っている指定番地では数が大きすぎるので適当な数を入れる
path = [2] # 同上

while index != 6: # ウェブサイトで使っている指定番地では数が大きすぎるので適当な数を入れる
    index = pred[6, index] # 同上
    path.append(index)

Xs = [cncfq20adt['vertices'][x][0] for x in path]
Ys = [cncfq20adt['vertices'][x][1] for x in path]
plt.figure(figsize=(18,18))
ax = plt.subplot(111, aspect='equal')
tplot.plot(ax, **cncfq20adt)
ax.plot(Xs, Ys, '-', linewidth=5, color='blue'); \
plt.show()