- 乱数は使うので、ちょっと確認
- ライブラリはnumpyのnumpy.random
- 基本的な使い方(日本語)はこちら
- Mersenne-Twisterのようだ(こちらの最後のあたりに、"RandomState Container for the Mersenne Twister pseudo-random number generator."とある。また、こちらにMersenne-Twisterのシード・リセットについての記載がある)
- このライブラリがどうなっているか、はこちらの構成は見ればよくて、以下の4部構成
- Simple random data 確率分布を使わずに、「単純な乱数」(実数の一様乱数、整数の一様乱数、みたいな)
- Permutations 順列・並べ替え
- Distributions 確率分布
- Random generator 疑似乱数列生成の設定関係(シード管理とか)
- 使ってみましょう。基本は、こちらの各関数のページを開いてExamplesを実行してみればよい
- 一様乱数 np.random.rand() 。[0,1)一様乱数を(d0,d1,d2,...)次元アレイで返す。10x3行列を作る
out = np.random.rand(10,3)
out
Out[256]:
array([[ 0.19162638,  0.83929495,  0.2009767 ],
       [ 0.80811309,  0.98031154,  0.65227689],
       [ 0.10042814,  0.74191348,  0.37695682],
       [ 0.3254057 ,  0.25791486,  0.07141353],
       [ 0.17206576,  0.47565466,  0.62595007],
       [ 0.59563655,  0.85788282,  0.52195865],
       [ 0.2047815 ,  0.14559446,  0.00507101],
       [ 0.94921072,  0.57972554,  0.69046393],
       [ 0.6801697 ,  0.04802326,  0.12613681],
       [ 0.27936615,  0.67153387,  0.21113059]])
out.shape
Out[257]: (10, 3)
-
- Rのapply()みたいなのを使って、行平均・列平均を出してみる
out = np.random.rand(100000,1000)
mean0 = np.apply_along_axis(mean,0,out)
mean1 = np.apply_along_axis(mean,1,out)
len(mean0)
Out[262]: 1000
len(mean1)
Out[264]: 100000
-
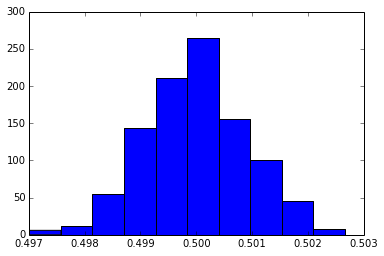
- Ipythonコンソールを使ってやっているが、そのコンソール上に現れるヒストグラムを右クリックするとメニューが出て、save imageできる
hist(mean0)

var(mean0)
Out[266]: 8.397405668976264e-07

var(mean1)
Out[267]: 8.3046862066615823e-05
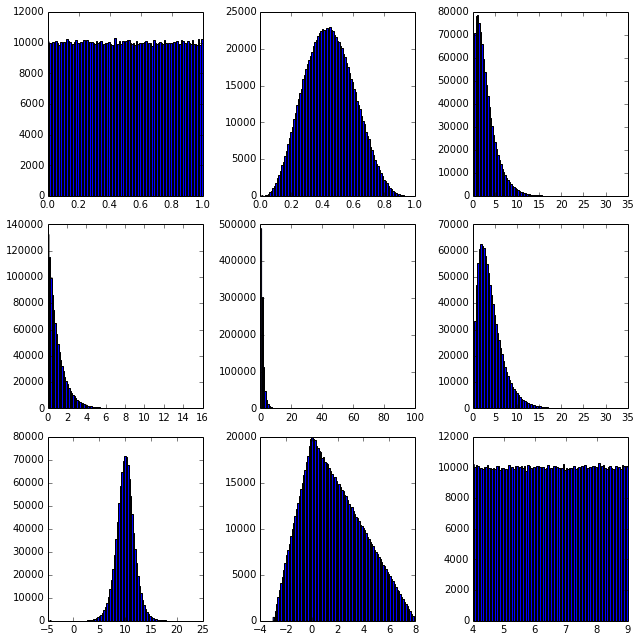
- いろいろな分布関数の扱いとともに、matplotlib.pyplotを使ってプロットのレイアウトを変えることとか、やってみる。9x9の領域に1/3,1/3を占めるようにして、隙間なく並べる、ということ(らしい)。matplotlib.pyplot.hist()関数は、ビン幅のデフォルトが固定らしい(Rでは幅決め法を指定するのだが。ここが「統計系のR」と「データ実直系のpython」ということか)
import matplotlib as pl
n = 10**6
pl.pyplot.figure(figsize=(9,9))
pl.pyplot.subplot(3,3,1)
pl.pyplot.hist(np.random.rand(n),bins=100)
pl.pyplot.subplot(3,3,2)
pl.pyplot.hist(np.random.beta(4,5,n),bins=100)
pl.pyplot.subplot(3,3,3)
pl.pyplot.hist(np.random.chisquare(3,n),bins=100)
pl.pyplot.subplot(3,3,4)
pl.pyplot.hist(np.random.exponential(1,n),bins=100)
pl.pyplot.subplot(3,3,5)
pl.pyplot.hist(np.random.f(5,8,n),bins=100)
pl.pyplot.subplot(3,3,6)
pl.pyplot.hist(np.random.gamma(2,2,n),bins=100)
pl.pyplot.subplot(3,3,7)
pl.pyplot.hist(np.random.logistic(10,1,n),bins=100)
pl.pyplot.subplot(3,3,8)
pl.pyplot.hist(np.random.triangular(-3,0,8,n),bins=100)
pl.pyplot.subplot(3,3,9)
pl.pyplot.hist(np.random.uniform(4,9,n),bins=100)
pl.pyplot.tight_layout()
pl.pyplot.show()

- サンプリングは、np.random.choice()
np.random.choice(range(5),3)
Out[17]: array([2, 4, 1])
# replace=Trueがデフォルトなので、ベクトルより長い個数を取り出せる
np.random.choice(range(5),10)
Out[18]: array([1, 1, 2, 3, 2, 2, 1, 4, 0, 2])
# サンプリング確率を指定
np.random.choice(range(5),100,p=[0.1,0.1,0.1,0.1,0.6])
Out[19]:
array([4, 4, 2, 4, 4, 2, 4, 4, 3, 4, 4, 3, 4, 4, 4, 0, 4, 1, 4, 4, 1, 4, 4,
       0, 4, 4, 4, 4, 4, 4, 1, 1, 4, 2, 4, 4, 3, 2, 3, 4, 0, 4, 4, 0, 1, 4,
       1, 4, 4, 4, 4, 0, 4, 4, 4, 4, 4, 4, 3, 3, 0, 4, 3, 4, 0, 4, 4, 1, 3,
       4, 3, 4, 0, 4, 4, 4, 4, 4, 4, 1, 1, 4, 4, 4, 4, 1, 4, 1, 4, 4, 4, 4,
       4, 2, 2, 4, 1, 4, 4, 4])
# replace=Trueがデフォルト
np.random.choice(range(10),8,replace=False)
Out[22]: array([8, 2, 5, 1, 6, 7, 9, 3])
arr = np.arange(10)

np.random.shuffle(arr)

arr
Out[35]: array([8, 7, 4, 3, 2, 1, 9, 5, 6, 0])
np.random.permutation(10)
Out[36]: array([3, 4, 1, 0, 5, 2, 9, 6, 7, 8])

