- 1.1 Generalized Linear Models
- 1.1.1 普通の線形回帰
from sklearn import linear_model
clf = linear_model.LinearRegression()
x = [[0, 0], [1, 1], [2, 2]]
y = [0, 1, 2]

clf.fit (x, y)
clf.coef_
clf.intercept_
-
- xは二次元アレイ、yは一次元アレイ。clfオブジェクトへのfitの実行は、
x
Out[154]: [[0, 0], [1, 1], [2, 2]]
y
Out[155]: [0, 1, 2]
clf.fit(x,y)
Out[156]: LinearRegression(copy_X=True, fit_intercept=True, n_jobs=1, normalize=False)
clf.coef_
Out[165]: array([ 0.5,  0.5])
clf.intercept_
Out[166]: 1.1102230246251565e-16
-
- 切片なしのモデルは次のようにやる
- clfオブジェクトのデフォルトのfit_intercept設定はTrueなので、それをFalseにしてから回帰する
clf.fit_intercept
clf.fit_intercept = False
clf.fit_intercept
clf.fit(x,y)
clf.coef_
clf.intercept_
clf.fit_intercept
Out[158]: True
clf.fit_intercept
Out[160]: False
clf.fit(x,y)
Out[161]: LinearRegression(copy_X=True, fit_intercept=False, n_jobs=1, normalize=False)
clf.coef_
Out[162]: array([ 0.5,  0.5])
clf.intercept_
Out[166]: 0.0
import numpy as np
import scipy as sp
import matplotlib as mp
import pylab as pl
import os
n = 100
d = 1
x = np.array(sp.randn(n*d))
x.shape = (n,d)
x
a1 = 3.4
a2 = 2.3
err = sp.randn(n) * 0.5
y = a1 * x[:,0] + a2 + err
plot(x,y,"o")
clf.fit(x,y)
clf.coef_
clf.intercept_
x2 = np.array([x[:,0],np.ones(n)]).T
y = a1 * x2[:,0] + a2 * x2[:,1] + sp.randn(n)*0.1
clf.fit(x2,y,intercept=FALSE)
clf.coef_
clf.fit(x[:,0],y)
pl.plot(x[:,0],y,"o")
import numpy as np
import scipy as sp
import matplotlib as mp
import pylab as pl
import os
from sklearn import linear_model
n = 100
d = 5
x = np.array(sp.randn(n*d))
x.shape = (n,d)
x
a1 = 3.4
a2 = 2.3
err = sp.randn(n) * 0.5
y = a1 * x[:,0] + a2 * x[:,1] + sp.randn(n)*0.1
clf.fit(x,y)
clf.coef_
clf.intercept_
-
- 1.1.2 リッジ回帰
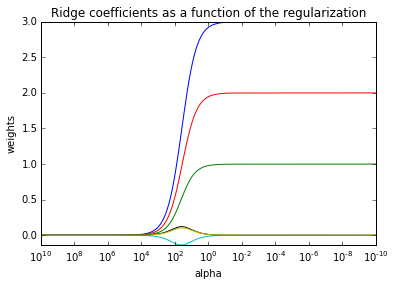
- 制約付き回帰:係数の二乗和が大きくならないような制約を入れる
- 制約の強さを1変数でパラメタ化する。パラメタが大きければ、すべての変数の係数が0になり、パラメタが小さければ、線形回帰に一致する
import scipy as sp
import matplotlib.pyplot as plt
import pylab as pl
import os
from sklearn import linear_model
n = 50
d = 6
x = np.array(sp.randn(n*d))
x.shape = (n,d)
beta = np.array([3,2,1,0,0,0])
err = sp.randn(n) * 0.1
y = sp.dot(x,beta) + err
clf = linear_model.Ridge (alpha = .1)
clf.fit (x, y)
clf.coef_
beta
n_alphas = 200
alphas = np.logspace(-10, 10, n_alphas)
clf = linear_model.Ridge(fit_intercept=False)
coefs = []
for a in alphas:
clf.set_params(alpha=a)
clf.fit(x, y)
coefs.append(clf.coef_)
ax = plt.gca()
ax.set_color_cycle(['b', 'r', 'g', 'c', 'k', 'y', 'm'])
ax.plot(alphas, coefs)
ax.set_xscale('log')
ax.set_xlim(ax.get_xlim()[::-1])
plt.xlabel('alpha')
plt.ylabel('weights')
plt.title('Ridge coefficients as a function of the regularization')
plt.axis('tight')
plt.show()

-
- Cross validationにより複数のパラメタ値候補の中から、適切なリッジパラメタを返す。クロス・バリデーションによりもっとも安定した推定結果をもたらすパラメタを選ぶ
clf = linear_model.RidgeCV(alphas=alphas)
clf.fit(x, y)
clf.alpha_
Out[247]: 0.013826221737646593
-
- 1.1.3 Lasso
- コード上は"linear_model.Ridge"を"linear_model.Lasso"に変えるだけ
- クロス・バリデーションなどは、特別にsklearn.linear_modelから読み込むものが必要
import numpy as np
import scipy as sp
import matplotlib.pyplot as plt
import pylab as pl
import os
from sklearn import linear_model
from sklearn.linear_model import LassoCV, LassoLarsCV, LassoLarsIC
import time
n = 50
d = 6
x = np.array(sp.randn(n*d))
x.shape = (n,d)
beta = np.array([3,2,1,0,0,0])
err = sp.randn(n) * 0.1
y = sp.dot(x,beta) + err
clf = linear_model.Lasso (alpha = .1)
clf.fit (x, y)
clf.coef_
beta
n_alphas = 200
alphas = np.logspace(-10, 10, n_alphas)
clf = linear_model.Lasso(fit_intercept=False)
coefs = []
for a in alphas:
clf.set_params(alpha=a)
clf.fit(x, y)
coefs.append(clf.coef_)
ax = plt.gca()
ax.set_color_cycle(['b', 'r', 'g', 'c', 'k', 'y', 'm'])
ax.plot(alphas, coefs)
ax.set_xscale('log')
ax.set_xlim(ax.get_xlim()[::-1])
ax.set_ylim([-1,4])
plt.xlabel('alpha')
plt.ylabel('weights')
plt.title('Ridge coefficients as a function of the regularization')
plt.show()
clf = linear_model.LassoCV(alphas=alphas)
clf.fit(x, y)
clf.alpha_
print("Computing regularization path using the coordinate descent lasso...")
t1 = time.time()
model = LassoCV(cv=20).fit(x, y)
t_lasso_cv = time.time() - t1
m_log_alphas = -np.log10(model.alphas_)
plt.figure()
ymin, ymax = 0,4
plt.plot(m_log_alphas, model.mse_path_, ':')
plt.plot(m_log_alphas, model.mse_path_.mean(axis=-1), 'k',
label='Average across the folds', linewidth=2)
plt.axvline(-np.log10(model.alpha_), linestyle='--', color='k',
label='alpha: CV estimate')
plt.legend()
plt.xlabel('-log(alpha)')
plt.ylabel('Mean square error')
plt.title('Mean square error on each fold: coordinate descent '
'(train time: %.2fs)' % t_lasso_cv)
plt.axis('tight')
plt.ylim(ymin, ymax)
-
- 1.1.4 Elastic net
- Exampleコードでpython コーディングの初歩を学ぶ
np.random.seed(42)
n_samples, n_features = 50, 200
X = np.random.randn(n_samples, n_features)
coef = 3 * np.random.randn(n_features)
inds = np.arange(n_features)
np.random.shuffle(inds)
coef[inds[10:]] = 0
y = np.dot(X, coef)
y += 0.01 * np.random.normal((n_samples,))
-
-
- 1.1.5 マルチタスク・ラッソ
- 複数の説明変数があり、複数の従属変数がある。いくつかの説明変数がそろって複数の従属変数に寄与がある。ただしその寄与係数は違う。そんなとき、個々の従属変数についてラッソをやるのではなく、全従属変数(タスク)に対して揃ってラッソ(選ぶべき説明変数のサブセットをそろえつつ、係数推定する。普通のラッソだと、各従属変数(各タスク)に対して係数がついたりつかなかったりするが、マルチタスク・ラッソだと揃ってつく
- ソースはコピペで動く
- 1.1.6 Least Angle Regression (LARs)
import numpy as np
import scipy as sp
import matplotlib.pyplot as plt
import pylab as pl
import os
from sklearn import linear_model
from sklearn.linear_model import LassoCV, LassoLarsCV, LassoLarsIC
import time
n = 50
d = 6
x = np.array(sp.randn(n*d))
x.shape = (n,d)
beta = np.array([3,2,1,0,0,0])
err = sp.randn(n) * 0.1
y = sp.dot(x,beta) + err
clf_lasso = linear_model.Lasso (alpha = .001)
clf_lars = linear_model.Lars(n_nonzero_coefs=d)
clf_lasso.fit(x,y)
clf_lars.fit(x,y)
print(clf_lasso.coef_)
print(clf_lars.coef_)
from sklearn.linear_model import LogisticRegression
C = 10
clf_l1_LR = LogisticRegression(C=C, penalty='l1', tol=0.01)
clf_l1_LR.fit(X, y)

import numpy as np
from matplotlib import pyplot as plt
from sklearn import linear_model, datasets
n_samples = 1000
n_outliers = 100
X, y, coef = datasets.make_regression(n_samples=n_samples, n_features=1,
n_informative=1, noise=10,
coef=True, random_state=0)
np.random.seed(0)
y[:n_outliers] = -3 + 10 * np.random.normal(size=n_outliers)
model = linear_model.LinearRegression()
model.fit(X, y)
model_ransac = linear_model.RANSACRegressor(linear_model.LinearRegression())
model_ransac.fit(X, y)
inlier_mask = model_ransac.inlier_mask_
outlier_mask = np.logical_not(inlier_mask)
line_X = np.arange(-5, 5)
line_y = model.predict(line_X[:, np.newaxis])
line_y_ransac = model_ransac.predict(line_X[:, np.newaxis])
print("Estimated coefficients (true, normal, RANSAC):")
print(coef, model.coef_, model_ransac.estimator_.coef_)
plt.plot(X[inlier_mask], y[inlier_mask], '.g', label='Inliers')
plt.plot(X[outlier_mask], y[outlier_mask], '.r', label='Outliers')
plt.plot(line_X, line_y, '-k', label='Linear regressor')
plt.plot(line_X, line_y_ransac, '-b', label='RANSAC regressor')
plt.legend(loc='lower right')
plt.show()
- 1.2 Linear and Quadratic Discriminant Analysis
- 1.2.1 LDA と QDA
- 独立変数が0,1の値を持つベクトルで、説明変数が行列であるときに、それぞれ、LDA,QDAをするためのオブジェクトを作成して、それのメンバー関数fit()でDiscriminationをさせる
from sklearn.discriminant_analysis import LinearDiscriminantAnalysis
from sklearn.discriminant_analysis import QuadraticDiscriminantAnalysis
lda = LinearDiscriminantAnalysis(solver="svd", store_covariance=True)
qda = QuadraticDiscriminantAnalysis(store_covariances=True)
- 1.3 Kernel ridge regression
- 1.4 Support Vector Machines
- 1.5 Stochastic Gradient Descent
- 1.6 Nearest Neighbors
- 1.7 Gaussian Processes
- 1.8 Cross Decomposition
- 1.9 Naive Bayes
- 1.10 Decision Tree
- 1.11 Ensemble Methods
- 1.12 Multiclass and Multilabel Algorithm
- 1.13 Feature Selection
- 1.14 Semi-Supervised
- 1.15 Isotonic Regression
- 1.16 Probability Calibration

