Z <- matrix(rnorm(20), ncol = 4)
rownames(Z) <- letters[1:nrow(Z)]
colnames(Z) <- LETTERS[1:ncol(Z)]
xtable(Z, dec = 1, caption = "Example of using xtable to create table",center = "centering", file = "", floating = FALSE)
- とすると、以下のようなてふのテーブル書式の文字列が出力される。これをSweave内で出力させてやる
> xtable(Z, dec = 1, caption = "Example of using xtable to create table",center = "centering", file = "", floating = FALSE)
% latex table generated in R 3.0.1 by xtable 1.7-3 package
% Wed May 07 10:32:48 2014
\begin{table}[ht]
\centering
\begin{tabular}{rrrrr}
  \hline
 & A & B & C & D \\
  \hline
a & 1.05 & 0.00 & -1.50 & 0.90 \\
  b & -0.34 & -0.36 & 0.67 & -3.36 \\
  c & 0.48 & -0.49 & -0.58 & 0.33 \\
  d & 0.93 & 1.43 & 0.11 & 1.49 \\
  e & -0.02 & -1.04 & -1.30 & -1.78 \\
   \hline
\end{tabular}
\caption{Example of using xtable to create table}
\end{table}
- Sweaveの方では、出力をてふ書式扱いせよ、と指示する
<<echo=FALSE,results=tex>>=
require(xtable)
Z <- matrix(rnorm(20), ncol = 4)
rownames(Z) <- letters[1:nrow(Z)]
colnames(Z) <- LETTERS[1:ncol(Z)]
xtable(Z, dec = 1, caption = "Example of using xtable to create table",center = "centering", file = "", floating = FALSE)
@
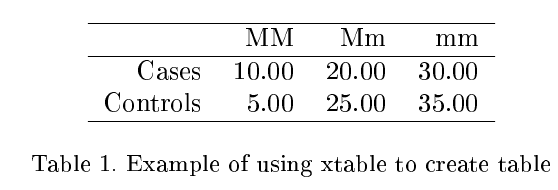
- そうすると、Sweave処理後のtexファイルには、と出る
\begin{table}[ht]
\centering
\begin{tabular}{rrrr}
\hline
& MM & Mm & mm \\
\hline
Cases & 10.00 & 20.00 & 30.00 \\
Controls & 5.00 & 25.00 & 35.00 \\
\hline
\end{tabular}
\caption{Example of using xtable to create table}
\end{table}

- いわゆる、データ解析出力としてのテーブルは次のようになる
library(xtable)
x <- rnorm(100)
y <- 4 + 3 * x + rnorm(100, 0, 2)
lmodel <- lm(y ~ x)

xtable(lmodel, caption = "Example of table from Linear regression model output.",floating = FALSE, label = "tab:coef")

lan <- anova(lmodel)
xtable(lan, caption = "Example of table from ANOVA", floating = FALSE,
label = "tab:coef2")
\begin{table}[ht]
\centering
\begin{tabular}{rrrrr}
\hline
& Estimate & Std. Error & t value & Pr($>$$|$t$|$) \\
\hline
(Intercept) & 3.4949 & 0.2061 & 16.95 & 0.0000 \\
x & 3.0554 & 0.2228 & 13.71 & 0.0000 \\
\hline
\end{tabular}
\caption{Example of table from Linear regression model output.}
\label{tab:coef}
\end{table}
\begin{table}[ht]
\centering
\begin{tabular}{lrrrrr}
\hline
& Df & Sum Sq & Mean Sq & F value & Pr($>$F) \\
\hline
x & 1 & 791.44 & 791.44 & 188.00 & 0.0000 \\
Residuals & 98 & 412.56 & 4.21 & & \\
\hline
\end{tabular}
\caption{Example of table from ANOVA}
\label{tab:coef2}
\end{table}


