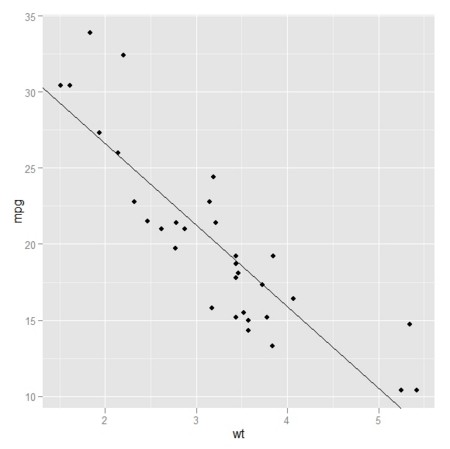
- 回帰直線を引く
- 直線の切片と傾きを求めて引いてもよいし、「線形回帰直線を引け」と命じてもよい
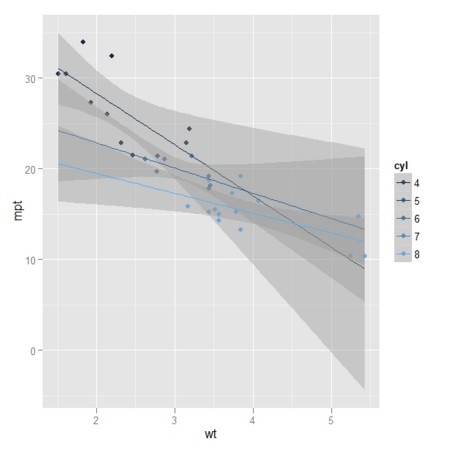
- グループ分けしてプロット・回帰するのもお手の物
wt <- mtcars$wt
mpg <- mtcars$mpg
cyl <- mtcars$cyl
gp <- qplot(wt, mpg)
print(gp)
cf <- coef(lm(mpg ~ wt))
gp + geom_abline(intercept = cf[1], slope = cf[2])
gp + stat_smooth(method="lm", se=FALSE)
gp.1 <- gp.1 <- qplot(wt,mpt,color=cyl)
gp.1 + geom_smooth(aes(group=cyl), method="lm", fullrange=TRUE)
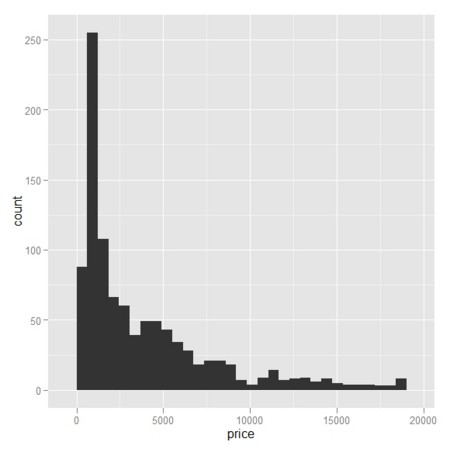
diamonds_small <- diamonds[sample(nrow(diamonds), 1000), ]
ggplot(diamonds_small, aes(x=price)) + geom_bar()
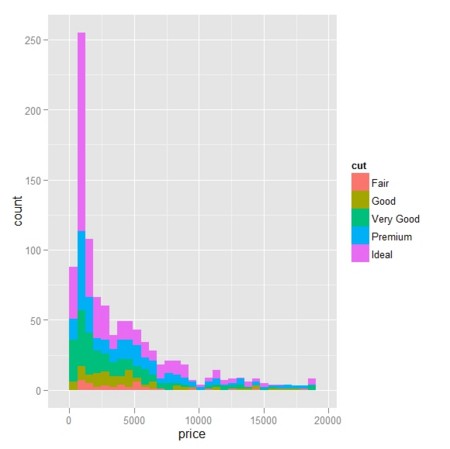
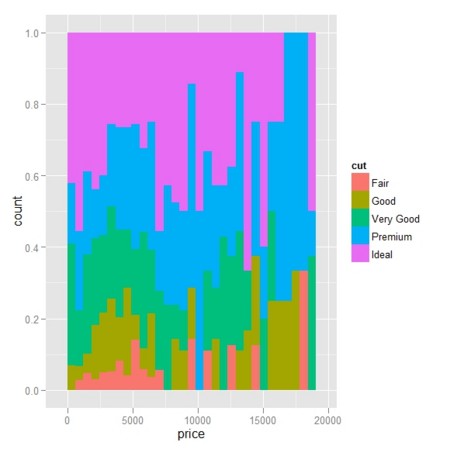
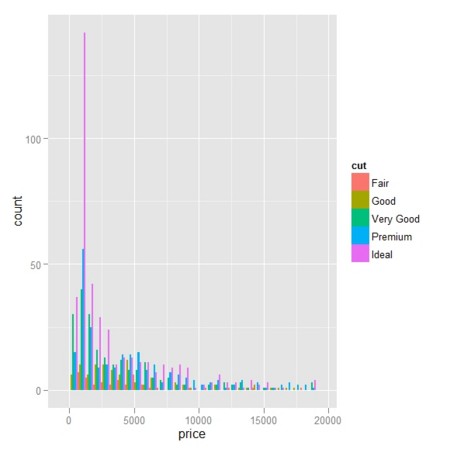
hist_cut <- ggplot(diamonds_small, aes(x=price, fill=cut))
hist_cut + geom_bar()
hist_cut + geom_bar(position="fill")
hist_cut + geom_bar(position="dodge")
par(ask=TRUE)
c <- ggplot(mtcars, aes(qsec, wt))
c + stat_smooth()
c + stat_smooth() + geom_point()
c + stat_smooth(se = FALSE) + geom_point()
c + stat_smooth(span = 0.9) + geom_point()
c + stat_smooth(level = 0.99) + geom_point()
c + stat_smooth(method = "lm") + geom_point()
library(splines)
library(MASS)
c + stat_smooth(method = "lm", formula = y ~ ns(x,3)) +
geom_point()
c + stat_smooth(method = rlm, formula= y ~ ns(x,3)) + geom_point()
c + stat_smooth(fill = "grey50", size = 2, alpha = 1)
c + stat_smooth(fill = "blue", size = 2, alpha = 1)
c + stat_smooth(fill="blue", colour="darkblue", size=2)
c + stat_smooth(fill="blue", colour="darkblue", size=2, alpha = 0.2)
c + geom_point() +
stat_smooth(fill="blue", colour="darkblue", size=2, alpha = 0.2)
c <- ggplot(mtcars, aes(y=wt, x=mpg)) + facet_grid(. ~ cyl)
c + stat_smooth(method=lm) + geom_point()
c + stat_smooth(method=lm, fullrange = TRUE) + geom_point()
c <- ggplot(mtcars, aes(y=wt, x=mpg, colour=factor(cyl)))
c + stat_smooth(method=lm) + geom_point()
c + stat_smooth(method=lm, aes(fill = factor(cyl))) + geom_point()
c + stat_smooth(method=lm, fullrange=TRUE, alpha = 0.1) + geom_point()
qplot(qsec, wt, data=mtcars, geom=c("smooth", "point"))
data("kyphosis", package="rpart")
qplot(Age, Kyphosis, data=kyphosis)
qplot(Age, data=kyphosis, facets = . ~ Kyphosis, binwidth = 10)
qplot(Age, Kyphosis, data=kyphosis, position="jitter")
qplot(Age, Kyphosis, data=kyphosis, position=position_jitter(height=0.1))
qplot(Age, as.numeric(Kyphosis) - 1, data = kyphosis) +
stat_smooth(method="glm", family="binomial")
qplot(Age, as.numeric(Kyphosis) - 1, data=kyphosis) +
stat_smooth(method="glm", family="binomial", formula = y ~ ns(x, 2))


