- こちらにMatlabとRとの相互参照関係がある。matlabのプロットはきれいなので、pythonではmatplolibのように「まねっこ」するライブラリもある(こちら)。この相互参照関係のうち、plotに関係する部分(7.Graphics)をなぞってみる
- 描図ウィンドウの開け閉め
dev.new()
n <- 3
dev.set(n)
dev.cur()
dev.off()
dev.off(n)
graphics.off()
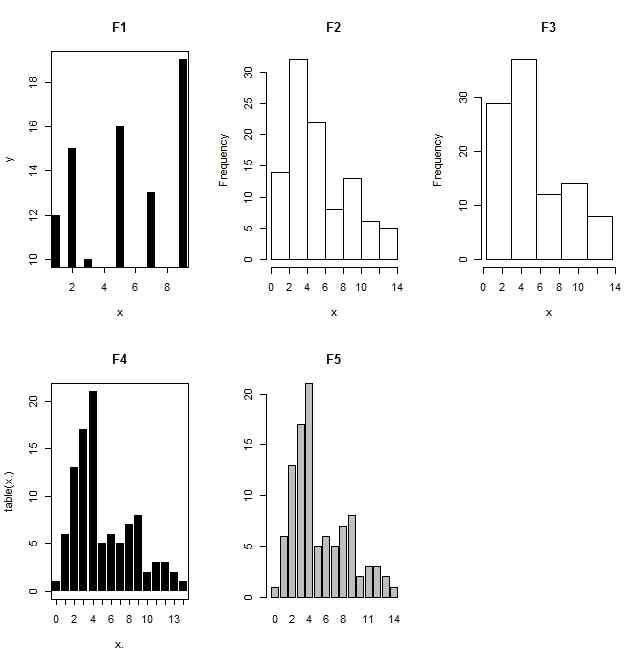
x <- sort(runif(30))*10
y <- sort(rchisq(30,5))
par(mfrow=c(2,3))
plot(x,y,main="F1")
plot(x,y,type="l",main="F2")
plot(x,y,type="b",pch=17,col="blue",lty=2,main="F3")
plot(x,y,log="x",main="F4")
plot(x,y,log="y",main="F5")
plot(x,y,log="xy",main="F6")
par(mfcol=c(1,1))
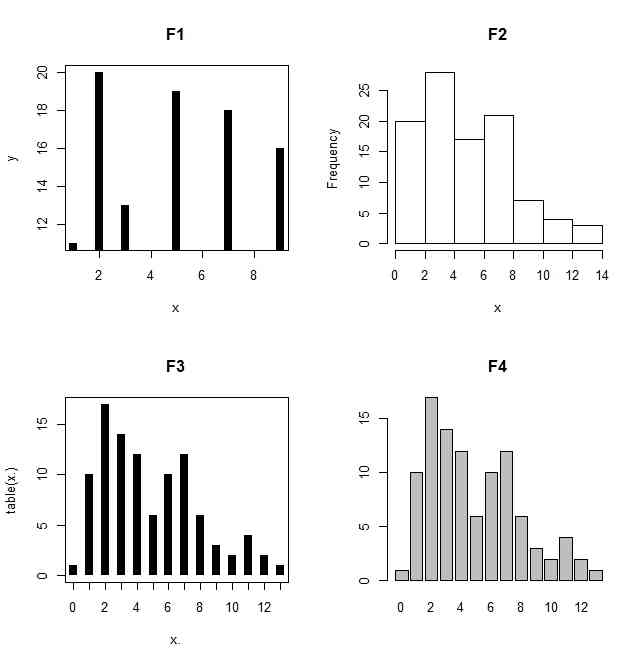
x <- c(1,2,3,5,7,9)
y <- sample(10:20,6)
par(mfrow=c(2,3))
plot(x,y,type="h",lwd=8,lend=1,main="F1")

x <- sort(rchisq(100,5))
hist(x,main="F2")
k <- 5
hist(x,seq(min(x),max(x),length.out=k+1),main="F3")
x. <- round(x)
plot(table(x.),lwd=8,lend=1,main="F4")
barplot(table(x.),main="F5")
par(mfrow=c(1,1))
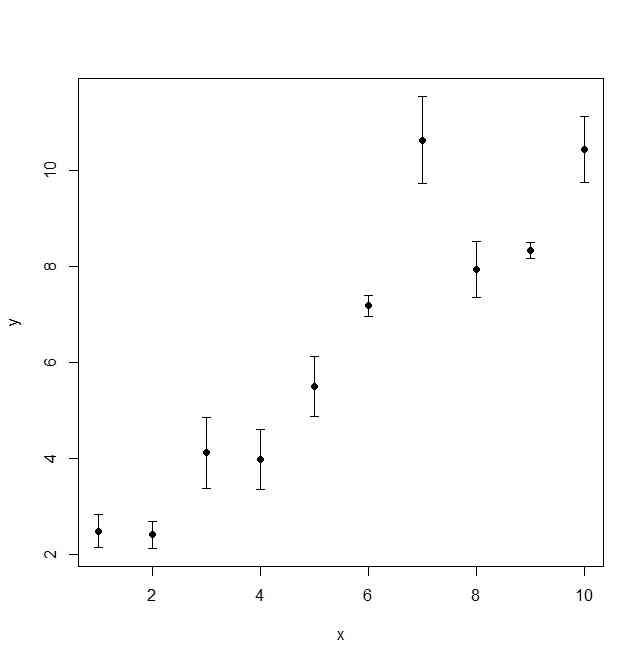
library(Hmisc)
x <- 1:10
y <- x + rnorm(10)
delta <- runif(10)
errbar( x, y, y + delta, y - delta )
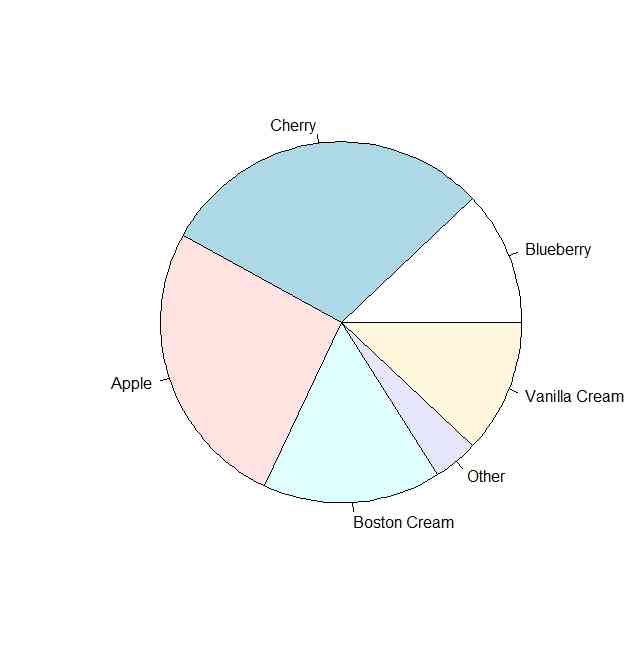
pie.sales <- c(0.12, 0.3, 0.26, 0.16, 0.04, 0.12)
names(pie.sales) <- c("Blueberry", "Cherry",
"Apple", "Boston Cream", "Other", "Vanilla Cream")
pie(pie.sales)
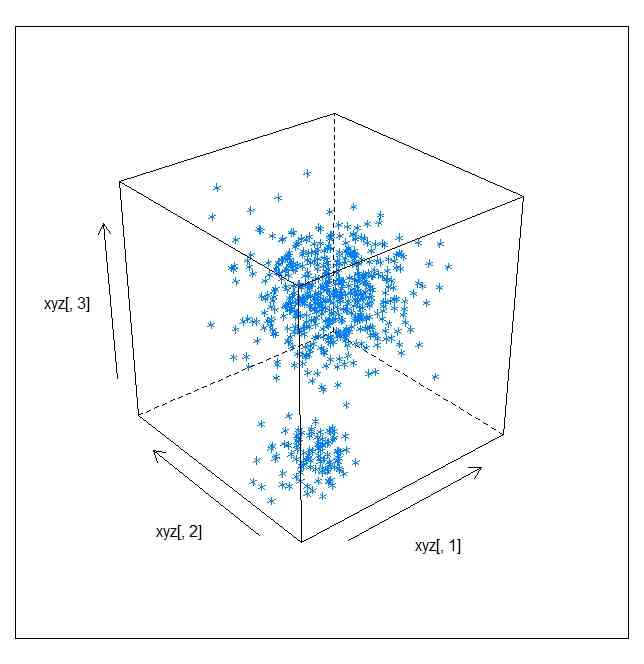
xyz <- matrix(rnorm(100*3),ncol=3)
xyz <- rbind(xyz,matrix(rnorm(500*3,5,2),ncol=3))
cloud(xyz[,3] ~ xyz[,1]*xyz[,2])
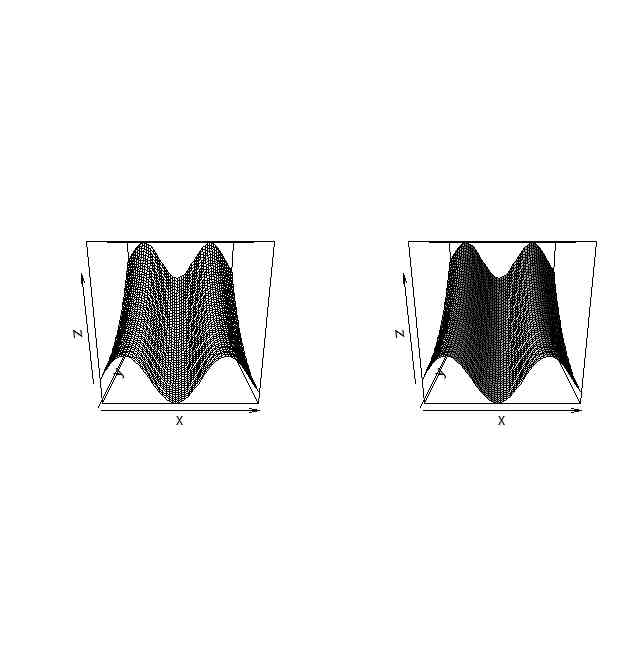
x <- seq(from=0,to=10,length=50)
y <- seq(from=0,to=2,length=50)
z <- matrix(0,length(x),length(y))
for(i in 1:length(x)){
for(j in 1:length(y)){
z[i,j] <- sin(x[i]) + y[j]^2
}
}
z.fx <- function(x,y){
sin(x)+y^2
}
z <- outer(x,y,z.fx)
par(mfcol=c(1,2))
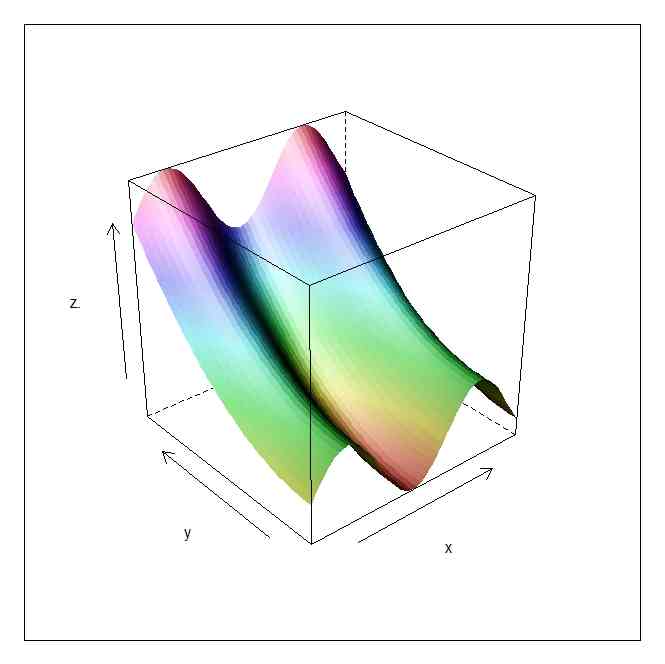
persp(x,y,z)
persp(x,y,z,shade=0.5)
par(mfcol=c(1,1))
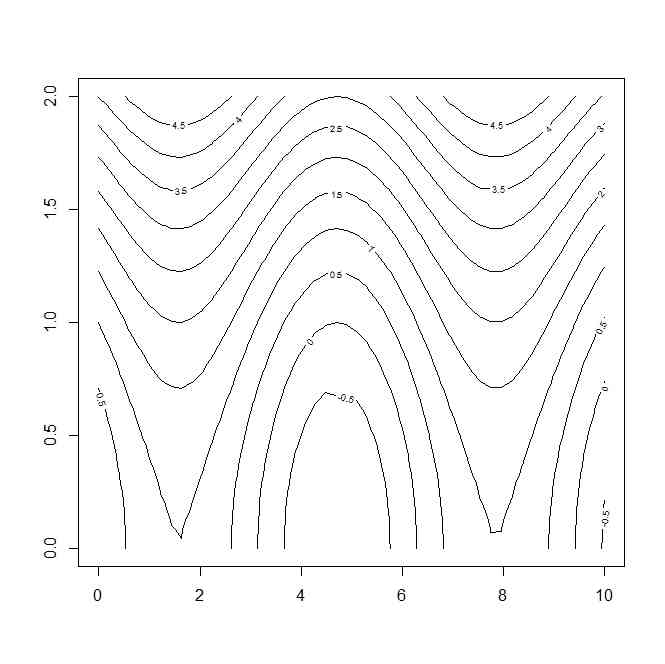
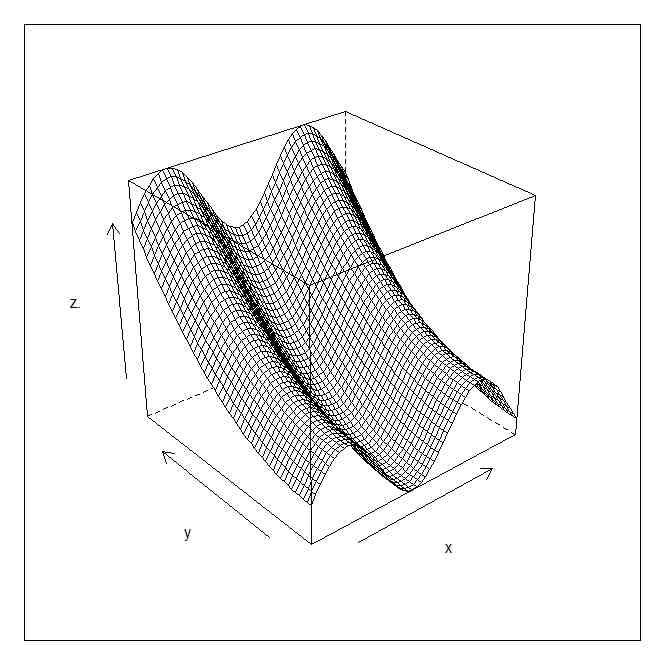
x <- seq(from=0,to=10,length=50)
y <- seq(from=0,to=2,length=50)
z.fx <- function(x,y){
	sin(x)+y^2
}
z. <- outer(x,y,z.fx)
contour(x,y,z.)
g <- expand.grid(x = x, y = y)
wireframe(z. ~ x * y,g)
wireframe(z. ~ x * y,g,shade=TRUE)
x <- sort(runif(30))*10
y <- sort(rchisq(30,5))
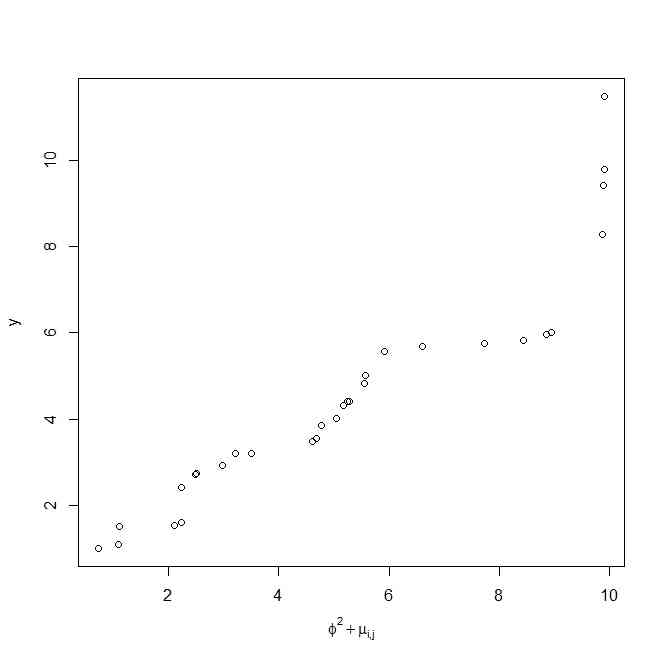
plot(x,y,xlab=expression(phi^2 + mu['i,j']))
help(plotmath)
plot(x,y)
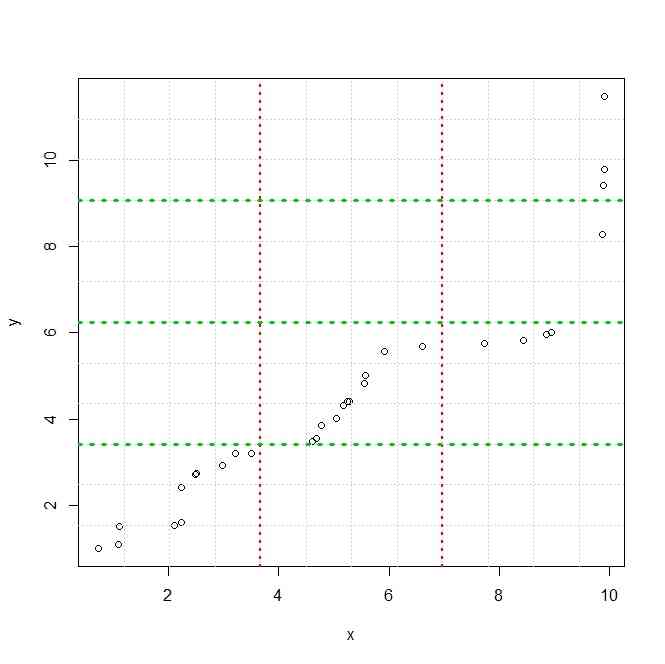
grid(12)
grid(3,NA,lwd=2,col=2)
grid(NA,4,lwd=3,col=3)
plot(x,y)
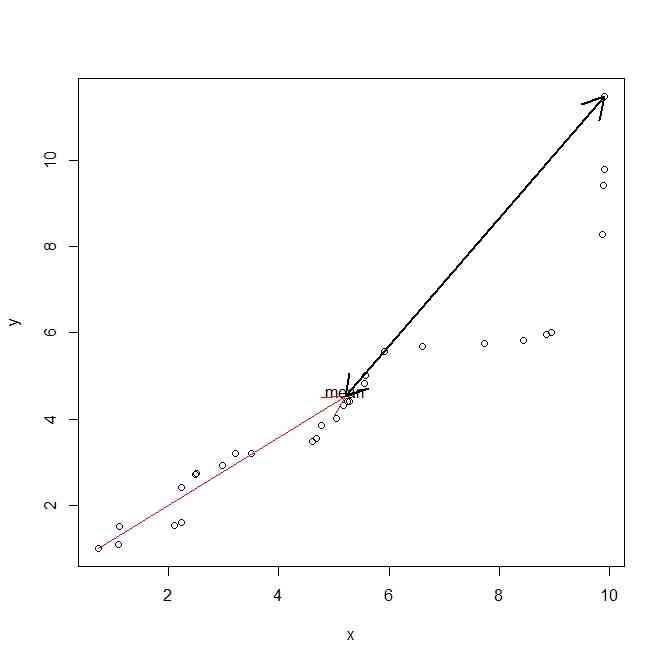
text(mean(x),mean(y)+0.1,"mean")
arrows(min(x),min(y),mean(x),mean(y),col=2)
arrows(max(x),max(y),mean(x),mean(y),code=3,lwd=2)
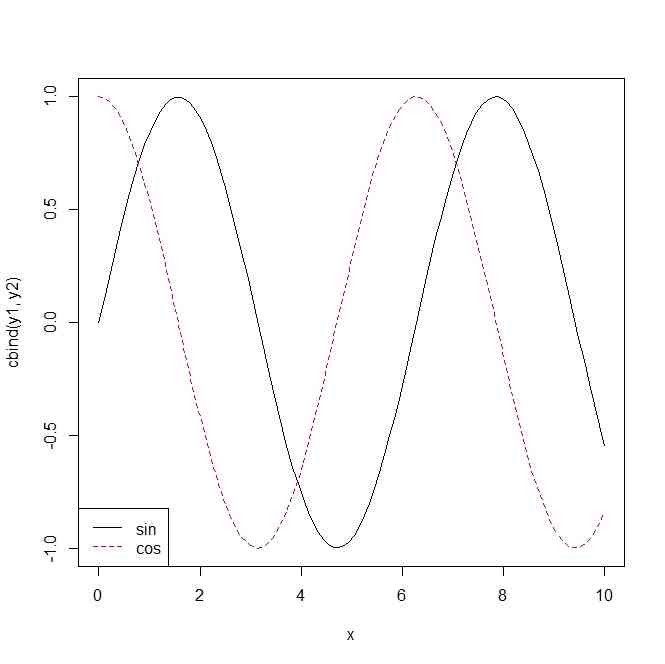
x <- seq(from=0,to=10,length=100)
y1 <- sin(x)
y2 <- cos(x)
matplot(x,cbind(y1,y2),type="l")
legend("bottomleft",c("sin","cos"),col=1:2,lty=1:2)
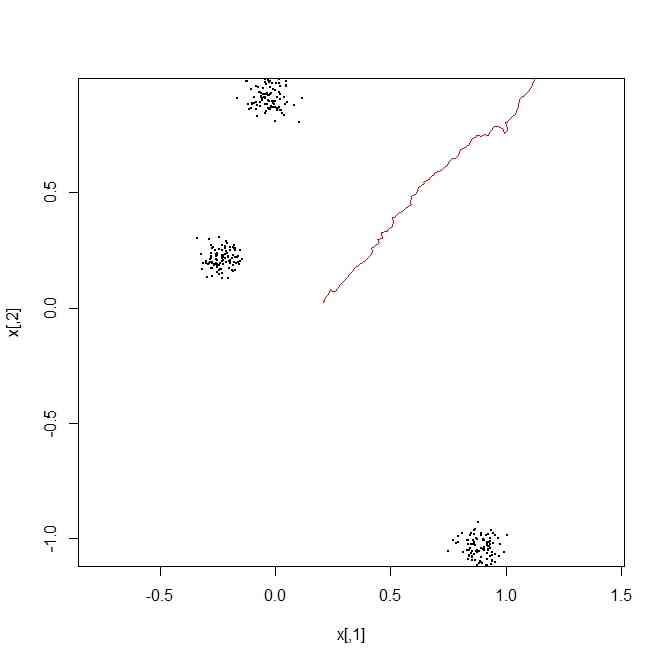
x <- matrix(rnorm(3*2),ncol=2)
plot(x,pch=20,cex=0,asp=TRUE)
for(i in 1:length(x[,1])){
	points(t(t(matrix(rnorm(100*2,0,0.05),ncol=2))+x[i,]),pch=20,cex=0.1)
}

random.walker <- matrix(rnorm(100*2,0.01,0.01),ncol=2)
random.walker[1,] <- apply(x,2,mean)
random.walker.2 <- apply(random.walker,2,cumsum)
lines(random.walker.2,type="l",col=2)

curve(sin(2*x),7,18,200)
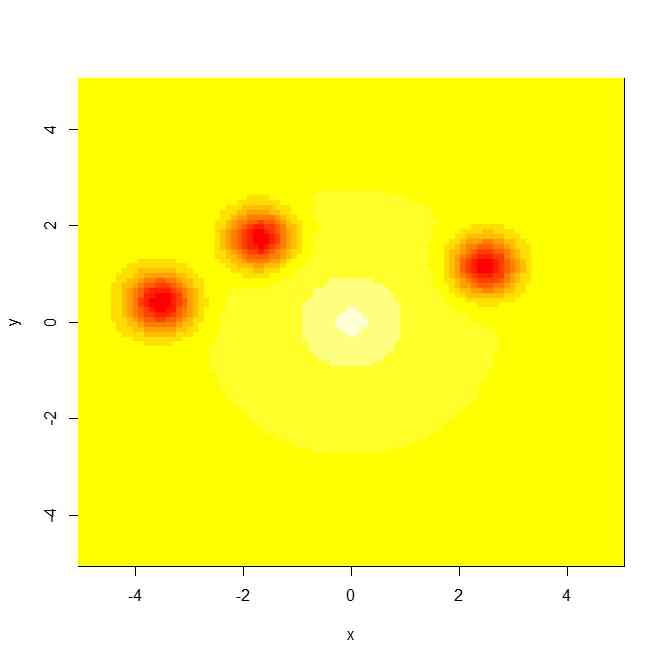
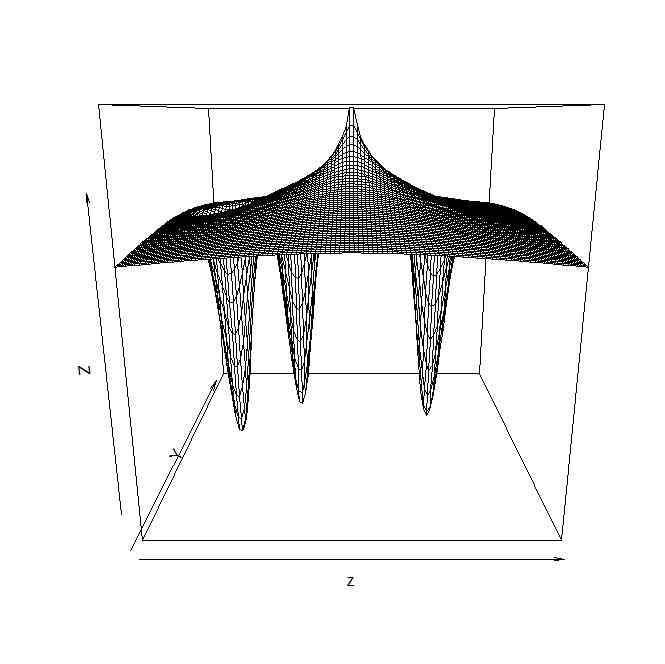
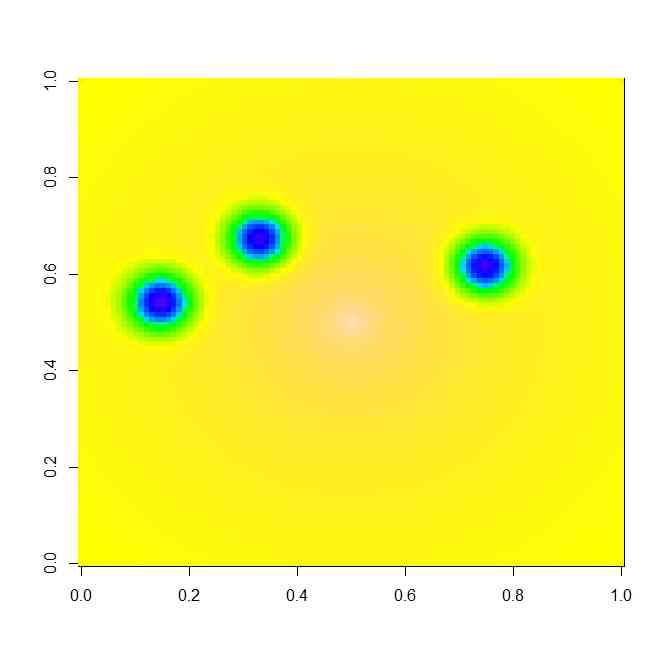
x <- y <- seq(from=-5,to=5,length=100)
z <- matrix(0,length(x),length(y))

w <- matrix(rnorm(3*2,0,2),ncol=2)
W <- 1
z.f <- function(x,y,w,W){
	tmp <- (x^2+y^2)^(1/20)
	tmp2 <- exp(-3*apply((t(t(w)-c(x,y)))^(2),1,sum)) *W
	-tmp-sum(tmp2)
}
z <- matrix(0, length(x),length(y))
for(i in 1:length(x)){
	for(j in 1:length(y)){
		z[i,j] <- z.f(x[i],y[j],w,W)
	}
}
image(x,y,z)
persp(z)
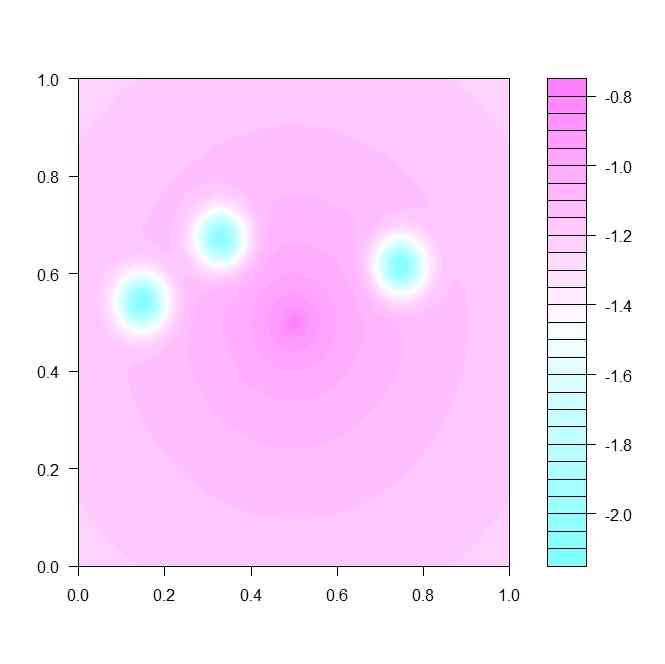
filled.contour(z)
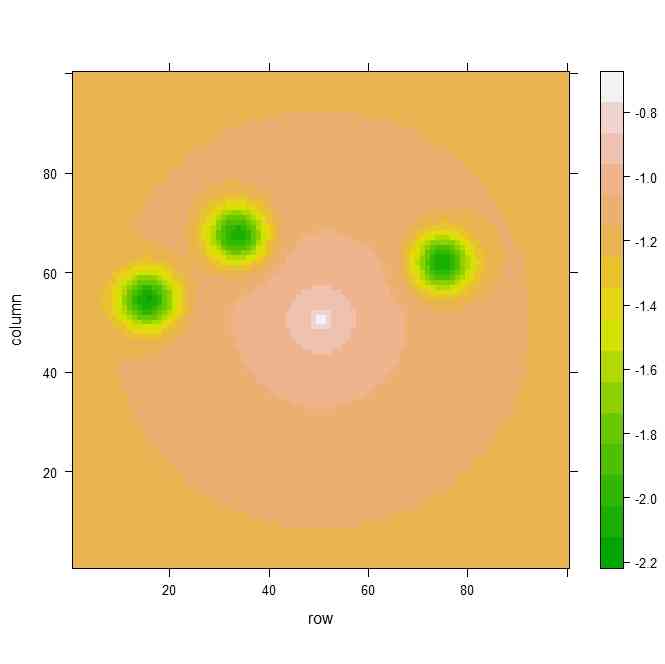
levelplot(z,col.regions=terrain.colors(100))
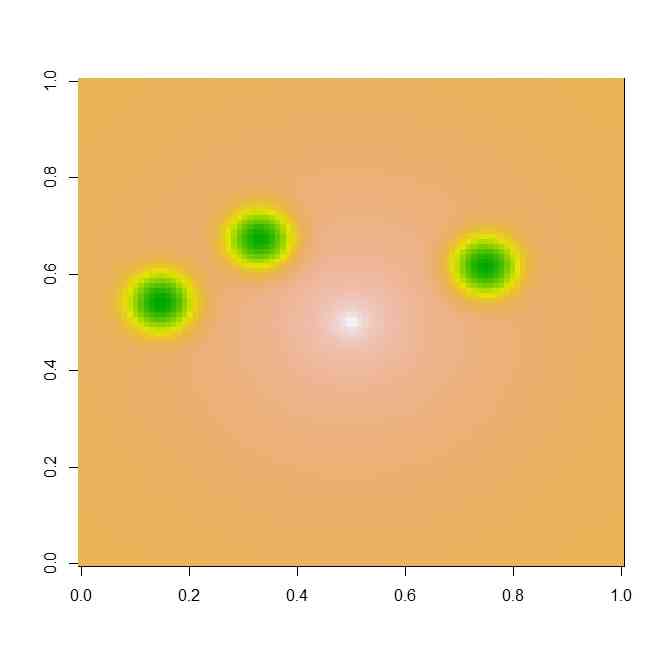
image(z,col=terrain.colors(100))
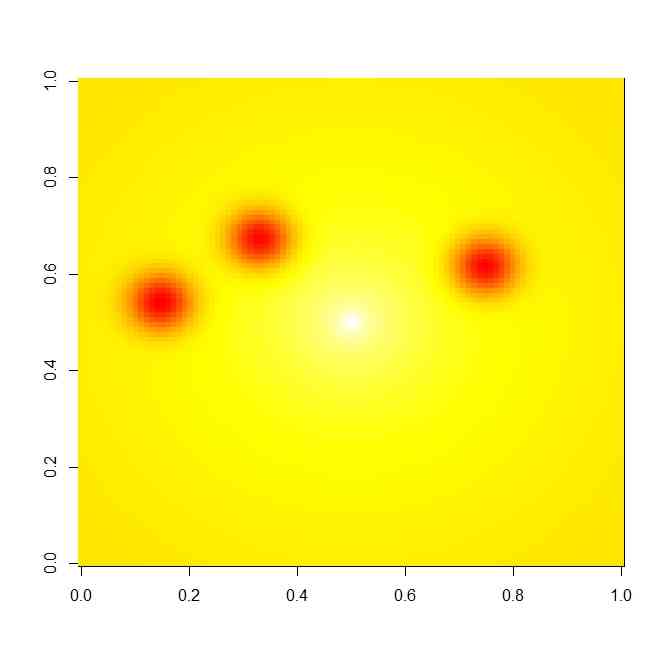
image(z,col=heat.colors(100))
image(z,col=topo.colors(100))


