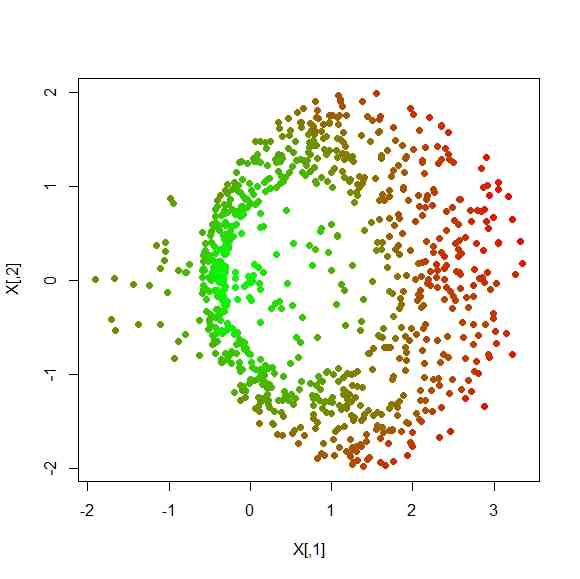
- 2次元空間にベルヌーイ事象の確率関数が広がっているとする
- その2次元空間で事象を観察すると、値0/1を持つ点が散在したデータが得られる
- その点の2次元空間におけるドロネー図を描き、そのドロネー図グラフにおける点間距離を定める
- そうすることで、各点は、0の点への距離分布と1の点への距離分布とが取れる
- 0/1の点がまとまりを持っているならば、各点の0への点の距離の和と1の点への距離の和とは何かしらの情報を持つだろう
- その2種類の距離和の比を点の属性として、色分けすると…

plot(X,col=rgb(len.ratio,1-len.ratio,0),pch=16)
library(quadprog)
library(geometry)
library(rgl)
library(gtools)
library(igraph)
library(vegan)
d <- 2
n.pt <- 500
X <- matrix(rnorm(n.pt*d),ncol=d)
ss <- sample(1:n.pt,n.pt/3)
X <- X -0.1
X[ss,] <- X[ss,] + 0.4
n.pt0 <- 100
n.pt1 <- 750
t0 <- runif(n.pt0)
r0 <- runif(n.pt0)
X0 <- r0 * cbind(2*cos(t0*2*pi), 1*sin(t0*2*pi))
t1 <- runif(n.pt1)
r1 <- runif(n.pt1)+1
X1 <- r1 * cbind(cos(t1*2*pi)+0.7,sin(t1*2*pi))
X <- rbind(X0,X1)
n.pt <- n.pt0+n.pt1
Y <- Y.jit <- c(rep(0,n.pt0),rep(1,n.pt1))
plot3d(cbind(X,Y.jit))
d.X <- delaunayn(X)
ed.list.delaunay <- function(d.X){
n <- length(d.X[1,])
comb <- combinations(n,2)
tmp <- matrix(0,0,2)
for(i in 1:length(comb[,1])){
tmp <- rbind(tmp,cbind(d.X[,comb[i,1]],d.X[,comb[i,2]]))
}
tmp <- as.data.frame(tmp)
tmp <- unique(tmp)
tmp
}
ed.list <- ed.list.delaunay(d.X)
g <- graph.edgelist(as.matrix(ed.list))
sh <- shortest.paths(g)
ed.len <- sqrt(apply((X[ed.list[,1],] - X[ed.list[,2],])^2,1,sum))
len <- shortest.paths(g,weights=ed.len,mode="all")
len.0 <- apply(sh[,which(Y.jit==0)],1,sum)
len.1 <- apply(sh[,which(Y.jit==1)],1,sum)
len.ratio <- len.0/(len.0+len.1)
len.ratio <- (len.ratio-min(len.ratio))/(max(len.ratio)-min(len.ratio))
plot(X,col=Y.jit+1,pch=16)
plot(X,col=rgb(len.ratio,1-len.ratio,0),pch=16)
segments(X[ed.list[,1],1],X[ed.list[,1],2],X[ed.list[,2],1],X[ed.list[,2],2])
