n<-10
i<-3
choose(n,i)
lchoose(n,i)
exp(lchoose(n,i))
factorial(1:10)
lfactorial(1:10)
exp(lfactorial(1:10))
factorial(1:10)
gamma(2:11)
lgamma(2:11)
exp(lgamma(2:11))
choose(n,i)
exp(lgamma(n+1)-lgamma(i+1)-lgamma(n-i+1))
> n<-10
> i<-3
> choose(n,i)
[1] 120
> lchoose(n,i)
[1] 4.787492
> exp(lchoose(n,i))
[1] 120
>
> factorial(1:10)
[1] 1 2 6 24 120 720 5040 40320 362880 3628800
>
> lfactorial(1:10)
[1] 0.0000000 0.6931472 1.7917595 3.1780538 4.7874917 6.5792512 8.5251614
[8] 10.6046029 12.8018275 15.1044126
> exp(lfactorial(1:10))
[1] 1 2 6 24 120 720 5040 40320 362880 3628800
>
> factorial(1:10)
[1] 1 2 6 24 120 720 5040 40320 362880 3628800
> gamma(2:11)
[1] 1 2 6 24 120 720 5040 40320 362880 3628800
>
> lgamma(2:11)
[1] 0.0000000 0.6931472 1.7917595 3.1780538 4.7874917 6.5792512 8.5251614
[8] 10.6046029 12.8018275 15.1044126
> exp(lgamma(2:11))
[1] 1 2 6 24 120 720 5040 40320 362880 3628800
>
> choose(n,i)
[1] 120
> exp(lgamma(n+1)-lgamma(i+1)-lgamma(n-i+1))
[1] 120
- 順列

- 全組合せ・全順列
> library(gtools)
> combinations(4,2)
     [,1] [,2]
[1,]    1    2
[2,]    1    3
[3,]    1    4
[4,]    2    3
[5,]    2    4
[6,]    3    4
> permutations(4,2)
      [,1] [,2]
 [1,]    1    2
 [2,]    1    3
 [3,]    1    4
 [4,]    2    1
 [5,]    2    3
 [6,]    2    4
 [7,]    3    1
 [8,]    3    2
 [9,]    3    4
[10,]    4    1
[11,]    4    2
[12,]    4    3
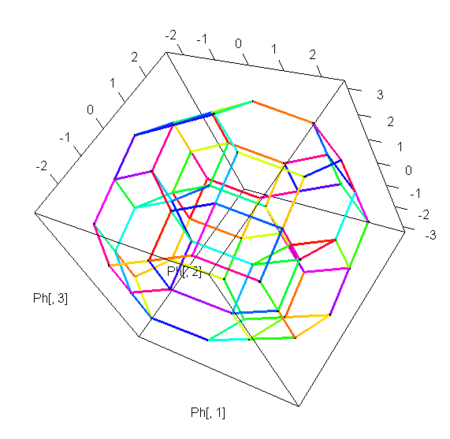
- 順列の空間配置 permutohedron (Wiki) を図にしてみる

CategoryVector<-
function (nc = 3)
{
df <- nc - 1
d <- df + 1
diagval <- 1:d
diagval <- sqrt((df + 1)/df) * sqrt((df - diagval + 1)/(df -
diagval + 2))
others <- -diagval/(df - (0:(d - 1)))
m <- matrix(rep(others, df + 1), nrow = df + 1, byrow = TRUE)
diag(m) <- diagval
m[upper.tri(m)] <- 0
as.matrix(m[, 1:df])
}
N<-5
X<-CategoryVector(N)
library(gtools)
p<-permutations(N,N)
Ph<-p%*%X
library(rgl)
Emax<-1000000
Ecounter<-0
E<-NULL
DifID<-NULL
for(i in 1:(length(p[,1])-1)){
for(j in (i+1):length(p[,1])){
tmp<-p[i,]-p[j,]
Ecounter<-Ecounter+1
if(length(which(tmp==0))==N-2 & length(which(abs(tmp)==1))==2){
E<-rbind(E,Ph[i,])
E<-rbind(E,Ph[j,])
DifID<-rbind(DifID,sort(which(abs(tmp)==1)))
}
if(Ecounter==Emax){
break
}
}
if(Ecounter==Emax){
break
}
}
plot3d(Ph[,1],Ph[,2],Ph[,3])
C<-DifID%*% matrix(c(1,N+1),2,1)
segments3d(E[,1:3],col=rainbow(C),lwd=3)
