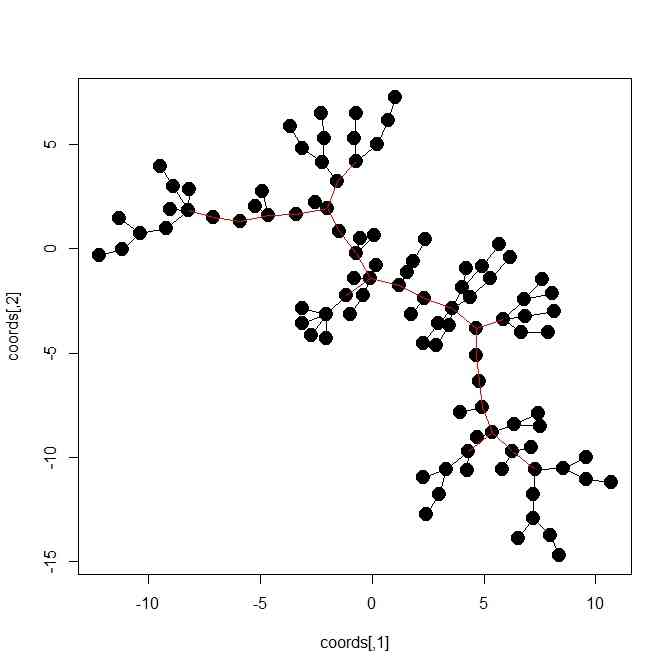
- 高次元データのヒストグラムとか平滑化とかをやっている
- 意味合いとしては、高次元空間にたなびく雲のその「形の本体」が知りたい、というところに(今のテーマは)ある
- こんな風にしてみよう
- 最小全域木を描く
- その上ですべての点ペアの最短パスを決める
- 最小全域木のエッジについて、その上のすべての点ぺの最短パスに登場する回数を、そのエッジの「主要度」とする
- こうすると、幹線道路と支線(枝)とに重みがつく
- そんなのをやってみる

d <- 6
n.pt <- 100
library(vegan)
library(GPArotation)
library(igraph)
t <- seq(from=0,to=1,length=n.pt)*2*pi
x <- cos(t)
y <- sin(t)
X <- matrix(0,n.pt,d)
X[,1] <- x
X[,2] <- y
R <- Random.Start(d)
X <- X %*% R
X <- X + rnorm(length(X),0,0.3)
plot(as.data.frame(X))
mst.out <- spantree(dist(X,method="manhattan"))
plot(mst.out)
mst2e <- function(v){
cbind(2:(length(v)+1),v)
}
e.list <- mst2e(mst.out$kid)
e.list.sorted <- t(apply(e.list,1,sort))
g <- graph.edgelist(e.list.sorted,directed =FALSE)
plot(g)
sh.p.list <- list()
for(i in 1:n.pt){
sh.p.list[[i]] <- get.shortest.paths(g,i)
}
e.cnt <- rep(0,length(e.list.sorted[,1]))
for(i in 1:n.pt){
for(j in 1:length(sh.p.list[[i]])){
for(k in 1:(length(sh.p.list[[i]][[j]])-1)){
tmp.ed <- sh.p.list[[i]][[j]][k:(k+1)]
tmp <- which(e.list.sorted[,1]==min(tmp.ed) & e.list.sorted[,2]==max(tmp.ed))
e.cnt[tmp] <- e.cnt[tmp] + 1
}
}
}
coords <- layout.kamada.kawai(g)
plot(g,layout = coords)
v.col <- rep(1,length(coords[,1]))
plot(coords,cex = 2, pch = 19, col = v.col)
e.col <- gray((e.cnt-min(e.cnt))/(max(e.cnt)-min(e.cnt)))
e.col <- rep(1,length(e.cnt))
e.col[which(e.cnt>mean(e.cnt))] <- 2
segments(coords[e.list.sorted[,1],1],coords[e.list.sorted[,1],2],coords[e.list.sorted[,2],1],coords[e.list.sorted[,2],2], col = e.col)
