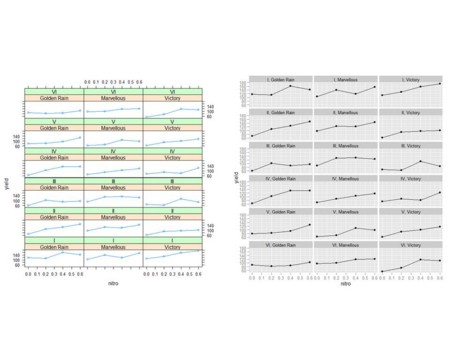
- 今回、使用するデータは4変数72サンプルのデータフレーム
library(lattice)
library(ggplot2)
data(Oats, package = "MEMSS")
> str(Oats)
'data.frame':   72 obs. of  4 variables:
 $ Block  : Factor w/ 6 levels "I","II","III",..: 1 1 1 1 1 1 1 1 1 1 ...
 $ Variety: Factor w/ 3 levels "Golden Rain",..: 3 3 3 3 1 1 1 1 2 2 ...
 $ nitro  : num  0 0.2 0.4 0.6 0 0.2 0.4 0.6 0 0.2 ...
 $ yield  : num  111 130 157 174 117 114 161 141 105 140 ...
dev.off()
tp1.oats <- xyplot(yield ~ nitro | Variety + Block, data = Oats, type = "o")
print(tp1.oats)
dev.new()
pg.oats <- ggplot(Oats, aes(nitro, yield)) + geom_line() + geom_point() + facet_wrap(~Block + Variety, ncol = 3)
print(pg.oats)
-
- latticeが左下から上へと描くのに対して、ggplot2が左上から下へと描く、という違いは前の記事と同じ
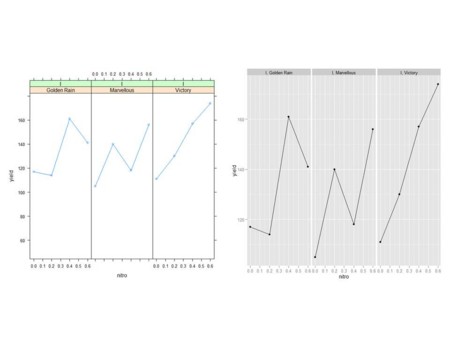
- 一度できた、描図情報を持ったオブジェクトのうち、一部を取り出してみる
dev.off()
print(tp1.oats[, 1])
dev.new()
pg <- pg.oats %+% subset(Oats, Block == "I")
print(pg)
help(subset)
dev.off()
pl <- update(tp1.oats, aspect = "xy")
print(pl)
dev.new()
library(grid)
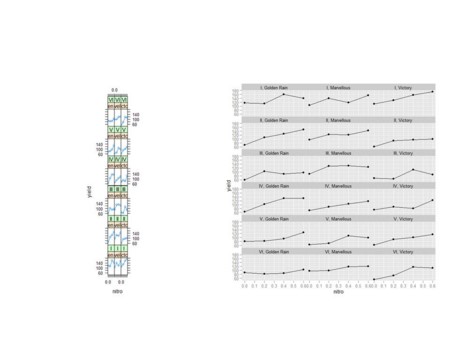
pg <- pg.oats + opts(panel.margin = unit(0, "lines"))
print(pg)
-
- 幅の調整に関してlatticeとggplot2とで完全一致させられていない
- 複数のグラフの配置変えとか、スペースの入れ方の細かい指定などについての例が出ているが、はっきり言って、興味がないので、飛ばします
- 視点を変えてプロット
> str(barley)
'data.frame': 120 obs. of 4 variables:
$ yield : num 27 48.9 27.4 39.9 33 ...
$ variety: Factor w/ 10 levels "Svansota","No. 462",..: 3 3 3 3 3 3 7 7 7 7 ...
$ year : Factor w/ 2 levels "1932","1931": 2 2 2 2 2 2 2 2 2 2 ...
$ site : Factor w/ 6 levels "Grand Rapids",..: 3 6 4 5 1 2 3 6 4 5 ...
dev.off()
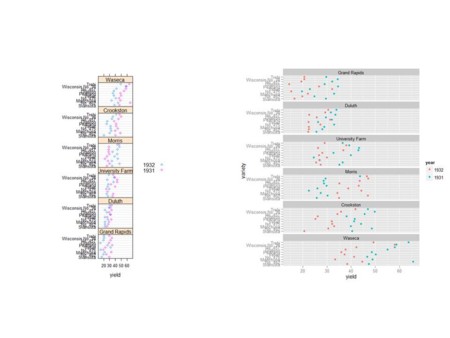
pl <- dotplot(variety ~ yield | site, barley, layout = c(1, 6), aspect = c(0.7), groups = year, auto.key = list(space = "right"))
print(pl)
dev.new()
pg <- ggplot(barley, aes(yield, variety, colour = year)) + geom_point() + facet_wrap(~site, ncol = 1)
print(pg)
dev.off()
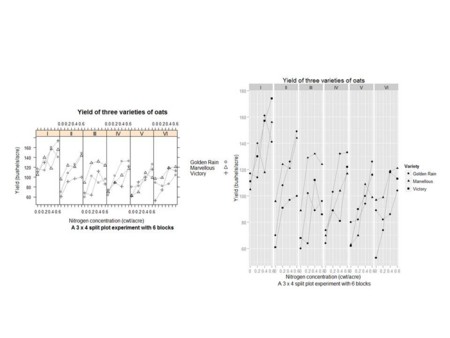
key.variety <- list(space = "right", text = list(levels(Oats$Variety)), points = list(pch = 1:3, col = "black"))
pl <- xyplot(yield ~ nitro | Block, Oats, aspect = "xy", type = "o", groups = Variety, key = key.variety, lty = 1, pch = 1:3, col.line = "darkgrey", col.symbol = "black", xlab = "Nitrogen concentration (cwt/acre)", ylab = "Yield (bushels/acre)", main = "Yield of three varieties of oats", sub = "A 3 x 4 split plot experiment with 6 blocks")
print(pl)
dev.new()
p <- ggplot(Oats, aes(nitro, yield, group = Variety, shape = Variety))
pg <- p + geom_line(colour = "darkgrey") + geom_point() + facet_grid(~Block) + scale_x_continuous(breaks = seq(0, 0.6, by = 0.2), labels = seq(0, 0.6, by = 0.2)) + opts(title = "Yield of three varieties of oats") + labs(x = "Nitrogen concentration (cwt/acre) \n A 3 x 4 split plot experiment with 6 blocks", y = "Yield (bushels/acre)")
print(pg)
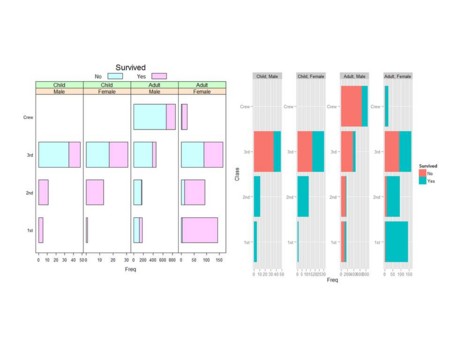
> str(Titanic)
 table [1:4, 1:2, 1:2, 1:2] 0 0 35 0 0 0 17 0 118 154 ...
 - attr(*, "dimnames")=List of 4
  ..$ Class   : chr [1:4] "1st" "2nd" "3rd" "Crew"
  ..$ Sex     : chr [1:2] "Male" "Female"
  ..$ Age     : chr [1:2] "Child" "Adult"
  ..$ Survived: chr [1:2] "No" "Yes"
dev.off()
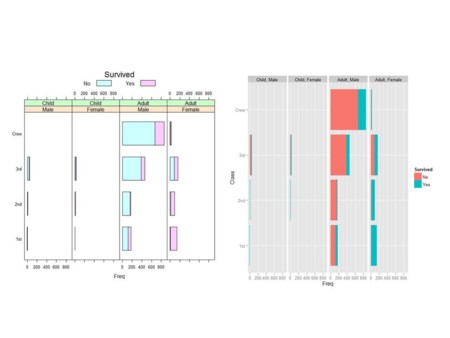
pl <- barchart(Class ~ Freq | Sex + Age, data = as.data.frame(Titanic), groups = Survived, stack = TRUE, layout = c(4, 1), auto.key = list(title = "Survived", columns = 2))
print(pl)
dev.new()
p <- ggplot(as.data.frame(Titanic), aes(Class, Freq, fill = Survived))
pg.titanic <- p + geom_bar(stat = "identity") + facet_wrap(~Age + Sex, nrow = 1) + coord_flip()
print(pg.titanic)
dev.off()
pl <- barchart(Class ~ Freq | Sex + Age, data = as.data.frame(Titanic), groups = Survived, stack = TRUE, layout = c(4, 1), auto.key = list(title = "Survived", columns = 2), scales = list(x = "free"))
print(pl)
dev.new()
pg <- pg.titanic + facet_wrap(~Age + Sex, nrow = 1, scales = "free")
print(pg)
