- 2つのライブラリーを読み込む、サンプルデータを決める
library(lattice)
library(ggplot2)
data(Chem97, package = "mlmRev")
- まず、描いてみる
- Chem97はデータフレームで、以下でも使うように"gcescoreという列とscoreという列を含む
> str(Chem97)
'data.frame':   31022 obs. of  8 variables:
 $ lea      : Factor w/ 131 levels "1","2","3","4",..: 1 1 1 1 1 1 1 1 1 1 ...
 $ school   : Factor w/ 2410 levels "1","2","3","4",..: 1 1 1 1 1 1 1 1 1 1 ...
 $ student  : Factor w/ 31022 levels "1","2","3","4",..: 1 2 3 4 5 6 7 8 9 10 ...
 $ score    : num  4 10 10 10 8 10 6 8 4 10 ...
 $ gender   : Factor w/ 2 levels "M","F": 2 2 2 2 2 2 2 2 2 2 ...
 $ age      : num  3 -3 -4 -2 -1 4 1 4 3 0 ...
 $ gcsescore: num  6.62 7.62 7.25 7.5 6.44 ...
 $ gcsecnt  : num  0.339 1.339 0.964 1.214 0.158 ...
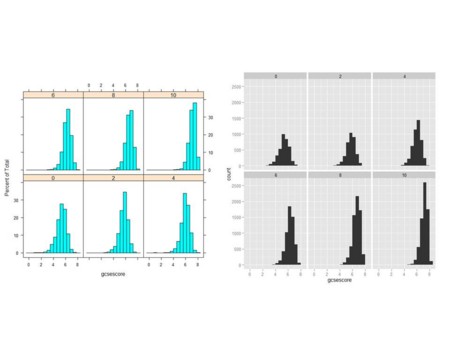
pl <- histogram(~gcsescore | factor(score), data = Chem97)
print(pl)
dev.new()
pg <- ggplot(Chem97, aes(gcsescore)) + geom_histogram(binwidth = 0.5) + facet_wrap(~score)
print(pg)

- latticeとggplot2の違い
- 縦軸:latticeのデフォルトは割合(パーセント)、ggplot2のデフォルトはカウント数
- 複数の図の配置:latticeは左下から、ggplot2は左上から
- これは、ggplot2の方が良いと思う人が多そうだ
- 色具合など:見た通り
- 補足
- histogram()はlatticeパッケージの関数
- "trellis"オブジェクトを返す
- "trellis"オブジェクトは描図のためのもろもろの情報を格納するリスト
- ggpolt()はggplot2パッケージの関数
- listオブジェクトを返す(特定のオブジェクトかどうか不明)
- このリストは描図のためのもろもろの情報を格納する
help(histogram)
help(ggplot)
help(geom_histogram)
help(facet_wrap)
typeof(pl)
typeof(pg)
str(pl)
str(pg)
dev.off()
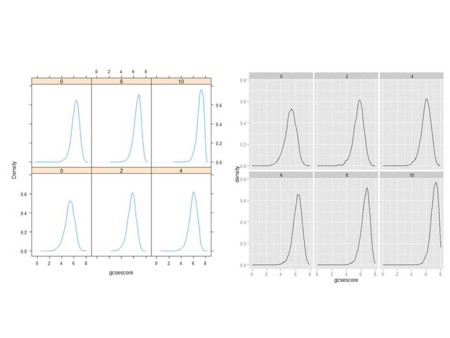
pl <- densityplot(~gcsescore | factor(score), data = Chem97, plot.points = FALSE, ref = TRUE)
print(pl)
dev.new()
pg <- ggplot(Chem97, aes(gcsescore)) + stat_density(geom = "path", position = "identity") + facet_wrap(~score)
print(pg)

dev.off()
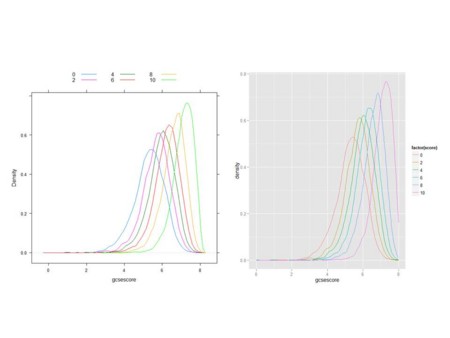
pl <- densityplot(~gcsescore, data = Chem97, groups = score, plot.points = FALSE, ref = TRUE, auto.key = list(columns = 3))
print(pl)
dev.new()
pg <- ggplot(Chem97, aes(gcsescore)) + stat_density(geom = "path", position = "identity", aes(colour = factor(score)))
print(pg)

- ggplot2に関するいくつか(こちらを参照)
- aes()
- aesthetics(見え方・見てくれ)に関すること
- geom
- 要素は、幾何学的に取り扱われる
- 点、線、線分、棒(四角)、文字列(points,lines,line segments,bars,text)


