- A=(a1,a2,...)だったら、B=(b1,b2,...)を確率的にシミュレーションする、とは
- B=(b1,b2,...)=f(A=(a1,a2,...)|P=(p1,p2,...))となるような変数P=(p1,p2,...)によって定まる関数f()を作り、その関数f()の内部でA=(a1,a2,...,)とP=(p1,p2,...)から乱数を使って演算をして、B=(b1,b2,...)を返させること
- 関数を作る
my.f<-function(h,b=20){
使われることがわかる
w<-b*h^2
return(list(weight=w,height=h,bmi.index=b))
}
my.h<-1.7
my.w20<-my.f(h=my.h)
b2<-25
my.w25<-my.f(h=my.h,b=b2)
my.w20
my.w25
> my.w20
$weight
[1] 57.8

$height
[1] 1.7

$bmi.index
[1] 20

> my.w25
$weight
[1] 72.25

$height
[1] 1.7

$bmi.index
[1] 25
- 何度か繰り返す、確率を入れる
- AさんとBさんとが、ジャンケンの5回勝負をして、5回のうち何回勝つかを調べてみる
- ただし、Aさん・Bさんともに、出し方に癖があって、グー・チョキ・パーを出す確率は、pa=(pa1,pa2,pa3),pb=(pb1,pb2,pb3)であるものとする
gcp<-function(n=1,prob=c(1/3,1/3,1/3)){
ret<-sample(1:3,n,replace=TRUE,prob=prob)
return(ret)
}
M<-matrix(c(0,1,-1,-1,0,1,1,-1,0),byrow=TRUE,ncol=3)
M
jyanken<-function(a,b){
M<-matrix(c(0,1,-1,-1,0,1,1,-1,0),byrow=TRUE,ncol=3)
return(M[a,b])
}
jyanken(1,2)
pa<-c(10,11,11)
pa<-pa/sum(pa)
pa
pb<-c(10,9,10)
pb<-pb/sum(pb)
pb
N<-1000
T<-rep(0,N)
for(i in 1:N){
a<-gcp(n=5,prob=pa)
b<-gcp(n=5,prob=pb)
tmp<-c()
for(j in 1:5){
tmp<-c(tmp,jyanken(a[j],b[j]))
}
T[i]<-length(which(tmp==1))
}
table(T)
> table(T)
T
  0   1   2   3   4   5
115 349 339 152  43   2
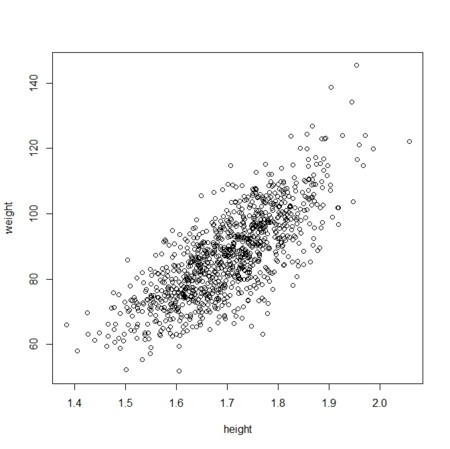
- BMIインデックスが20くらいの身長・体重データを適当に作る

N<-1000
height.mean<-1.7
height.sd<-0.1
height<-rnorm(N,mean=height.mean,sd=height.sd)
bmi.mean<-30
bmi.sd<-3
bmi<-rnorm(N,mean=bmi.mean,sd=bmi.sd)
weight<-my.f(h=height,b=bmi)$weight
plot(height,weight)
- どのくらい貯まるか
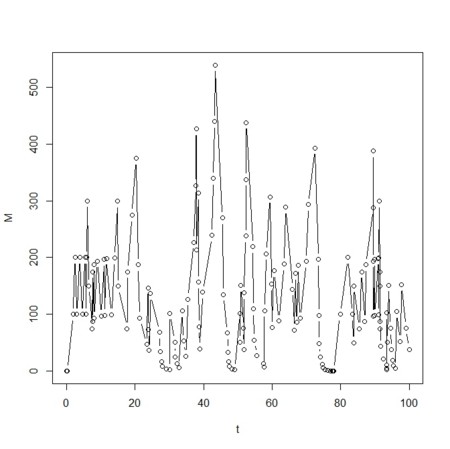
- ときどきブラリと現れては、小遣いを100円、置いていくおじさんと、ときどきブラリと現れては、持っているお金の半分を奪い去っていく、もう一人のおじさんがいるときの、所有金額の推移をみてみよう
p<-runif(1)
q<-runif(1)
T<-100
Ps<-rexp(T/p*5,p)
Qs<-rexp(T/q*5,q)
Ps2<-cumsum(Ps)
Qs2<-cumsum(Qs)
PQs2<-c(Ps2,Qs2)
PQs1<-c(rep(1,length(Ps2)),rep(2,length(Qs2)))
visit.order<-order(PQs2)
M<-c()
t<-c()
current.money<-0
current.time<-0
counter<-0
while(current.time<T){
M<-c(M,current.money)
t<-c(t,current.time)
counter<-counter+1
ojisan<-PQs1[visit.order[counter]]
current.time<-PQs2[visit.order[counter]]
if(ojisan==1){
current.money<-current.money+100
}else if(ojisan==2){
current.money<-current.money/2
}
}
plot(t,M,type="b")

> p
[1] 0.703699
> q
[1] 0.8556833

