- 昨日は球の分裂からの派生で円形・球面の度数分布について書いた
- そのとき、半径の広がりに応じて、指数関数的にセルを増やすことにしたのだが、よく考えたら、それは変
- タイリングなので、正六角形の埋め尽くし、とかが適当。球面なら、サッカーボール型か
- 正六角形タイル座標を決めたり(こちら)や、サッカーボールの座標を決めたり(こちら)とかでもよいが…
- タイルの数だけを参考にして、角座標で扇形に指定する方がやっぱり簡単か…
- 正六角形タイリングに模して、3次元球面を1,6,12,18と覆うとすると

Sphere.Histogram.3.2 <- function(X,ts,k){
ts.2 <- c(ts,ts[length(ts):1])
cum.ts <- cumsum(ts)
max.cum.ts <- cum.ts[length(cum.ts)]
phis <- c(0,acos(1-cum.ts/max.cum.ts))
diff.phis <- diff(phis)
phis <- c(phis[-length(phis)],cumsum(c(phis[length(phis)],diff.phis[length(diff.phis):1])))
Hist <- list()
thetas <- list()
for(i in 1:k){
thetas[[i]] <- seq(from = 0, to = 2*pi, length =ts[i]+1)
Hist[[i]] <- rep(0,length(thetas[[i]]-1))
}
tmpks <- k:1
for(i in 1:length(tmpks)){
thetas[[k+i]] <- thetas[[k+1-i]]
Hist[[k+i]] <- Hist[[k+1-i]]
}
print(thetas)
Cmpx <- complex(real = X[,1],imaginary = X[,2])
Md <- acos(X[,3])
Ag <- Arg(Cmpx)
neg <- which(Ag < 0)
Ag[neg] <- 2*pi +Ag[neg]
for(i in 1:length(Hist)){
s <- which(Md >= phis[i] & Md < phis[i+1])
a <- Ag[s] %/% (thetas[[i]][2]) +1
print(range(Ag[s]))
print(a)
Hist[[i]] <- tabulate(a,nbins = ts.2[i]+1)
Hist[[i]] <- Hist[[i]][-length(Hist[[i]])]
}
return(list(Hist=Hist,X=X,Md=Md,Ag=Ag,t=t,k=k,phis=phis,thetas=thetas))
}
n.pt <- 100000
X <- matrix(rnorm(n.pt*3),ncol=3)
X <- X/sqrt(apply(X^2,1,sum))
R <- sqrt(X[,1]^2+X[,2]^2)
the <- asin(R)
t <- seq(from=0,to=pi/2,length=100)
L <- rep(0,length(t))
for(i in 1:length(t)){
L[i] <- length(which(R <= sin(t[i])))
}
plot(t,L)
ts <- c(1,6,12,18)
sp.out3.2 <- Sphere.Histogram.3.2(X,ts,4)
sp.out3.2$Hist
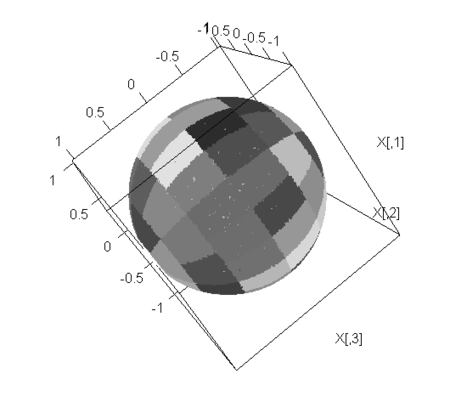
- プロットするには
- 得られたタイル別の度数を引数として渡しつつ、タイルのエリア情報を渡し、そこに乱点で色を付ける、ということでやってみよう
plot.SphereHist <- function(sp.out,ts,k,n=100000){
n.pt <- n
phis <- sp.out$phis
thetas <- sp.out$thetas
X <- matrix(rnorm(n.pt*3),ncol=3)
X <- X/sqrt(apply(X^2,1,sum))
Cmpx <- complex(real = X[,1],imaginary = X[,2])
Md <- acos(X[,3])
Ag <- Arg(Cmpx)
neg <- which(Ag < 0)
Ag[neg] <- 2*pi +Ag[neg]
cols <- rep(0,length(X[,1]))
for(i in 1:length(sp.out$Hist)){
s <- which(Md >= phis[i] & Md < phis[i+1])
a <- Ag[s] %/% (thetas[[i]][2]) +1
cols[s] <- sp.out$Hist[[i]][a]
}
library(rgl)
plot3d(X,col = gray((max(cols)-cols)/(max(cols)-min(cols))),cex=0.1)
}
plot.SphereHist(sp.out3.2,ts,k)

n.pt <- 100000
X <- matrix(rnorm(n.pt*3),ncol=3)
X[,1] <- X[,1] +1
tmp.X <- matrix(rnorm(n.pt*3),ncol=3)
tmp.X[,1] <- cos(tmp.X[,1]*8+pi/3)
tmp.X[,2] <- sin(tmp.X[,2]*10)
tmp.X[,3] <- cos(tmp.X[,3]*10)
X <- rbind(X,tmp.X)
X <- X/sqrt(apply(X^2,1,sum))
R <- sqrt(X[,1]^2+X[,2]^2)
the <- asin(R)
t <- seq(from=0,to=pi/2,length=100)
L <- rep(0,length(t))
for(i in 1:length(t)){
L[i] <- length(which(R <= sin(t[i])))
}
plot(t,L)
t.len <- 8
ts <- c(1,6*(1:t.len))
k <- length(ts)
sp.out3.2 <- Sphere.Histogram.3.2(X,ts,k)
sp.out3.2$Hist
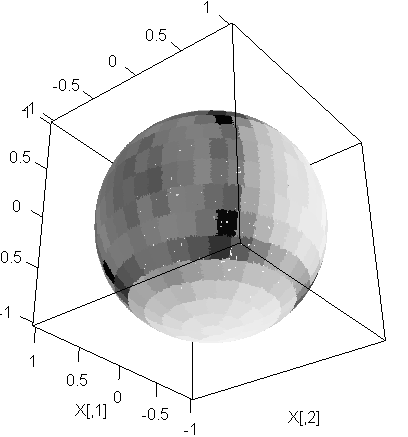
plot.SphereHist <- function(sp.out,ts,k,n=100000){
n.pt <- n
phis <- sp.out$phis
thetas <- sp.out$thetas
X <- matrix(rnorm(n.pt*3),ncol=3)
X <- X/sqrt(apply(X^2,1,sum))
Cmpx <- complex(real = X[,1],imaginary = X[,2])
Md <- acos(X[,3])
Ag <- Arg(Cmpx)
neg <- which(Ag < 0)
Ag[neg] <- 2*pi +Ag[neg]
cols <- rep(0,length(X[,1]))
for(i in 1:length(sp.out$Hist)){
s <- which(Md >= phis[i] & Md < phis[i+1])
a <- Ag[s] %/% (thetas[[i]][2]) +1
cols[s] <- sp.out$Hist[[i]][a]
}
library(rgl)
plot3d(X,col = gray((max(cols)-cols)/(max(cols)-min(cols))),cex=0.1)
}
plot.SphereHist(sp.out3.2,ts,k)


