- 特殊関数には、確率密度関数・累積密度関数などがある(こちらにリスト)
- 統計関数は、こちら(scipy.stats)に取りまとめなおしたのが使いやすい
import scipy.stats
df = 3
# chi2に対して、その統計量を問い合わせ mvsk : mean,var,skew,kurtosisを指定
mean, var, skew, kurt = sp.stats.chi2.stats(df, moments='mvsk')
# ppfはクオンタイル点を返す
x = np.linspace(0,sp.stats.chi2.ppf(0.99999, df), 100)
# pdfは確率密度関数
plot(x,sp.stats.chi2.pdf(x,df))
# 乱数発生
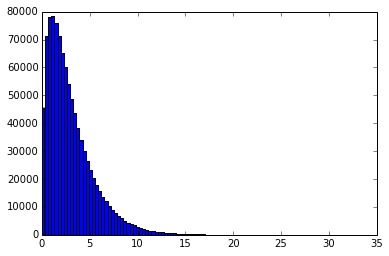
rs = sp.stats.chi2.rvs(df, size=1000000)
hist(rs,bins=100)

-
- chi2.pdf : dchisq, chi2.cdf : pchisq, chi2.ppf : qchisq, chi2.rsv : rchisq のようにRの関数と同じだが、それ以外に、生存関数、その逆関数などもある
Methods

rvs(df, loc=0, scale=1, size=1)	Random variates.
pdf(x, df, loc=0, scale=1)	Probability density function.
logpdf(x, df, loc=0, scale=1)	Log of the probability density function.
cdf(x, df, loc=0, scale=1)	Cumulative density function.
logcdf(x, df, loc=0, scale=1)	Log of the cumulative density function.
sf(x, df, loc=0, scale=1)	Survival function (1-cdf — sometimes more accurate).
logsf(x, df, loc=0, scale=1)	Log of the survival function.
ppf(q, df, loc=0, scale=1)	Percent point function (inverse of cdf — percentiles).
isf(q, df, loc=0, scale=1)	Inverse survival function (inverse of sf).
moment(n, df, loc=0, scale=1)	Non-central moment of order n
stats(df, loc=0, scale=1, moments=’mv’)	Mean(‘m’), variance(‘v’), skew(‘s’), and/or kurtosis(‘k’).
entropy(df, loc=0, scale=1)	(Differential) entropy of the RV.
fit(data, df, loc=0, scale=1)	Parameter estimates for generic data.
expect(func, df, loc=0, scale=1, lb=None, ub=None, conditional=False, **kwds)	Expected value of a function (of one argument) with respect to the distribution.
median(df, loc=0, scale=1)	Median of the distribution.
mean(df, loc=0, scale=1)	Mean of the distribution.
var(df, loc=0, scale=1)	Variance of the distribution.
std(df, loc=0, scale=1)	Standard deviation of the distribution.
interval(alpha, df, loc=0, scale=1)	Endpoints of the range that contains alpha percent of the distribution
from scipy.stats import multivariate_normal
# グリッド作る
x, y = np.mgrid[-1:1:.01, -1:1:.01]
# (100,100,2)という形のアレイを作る
pos = np.empty(x.shape + (2,))
pos[:, :, 0] = x; pos[:, :, 1] = y
# 2軸の平均
ms = [0.5,0.3]
# 分散共分散行列
vcv = [[2.0,0.3],[0.3,0.5]]
# 指定の平均と分散共分散行列で2次元正規分布を作り
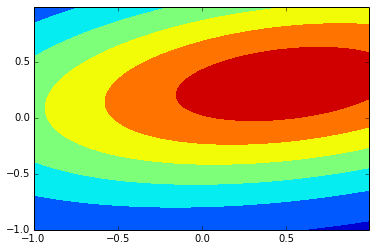
d2mv = sp.stats.multivariate_normal(ms, vcv)
# その確率密度分布をグリッド点に計算して描図
mp.pyplot.contourf(x, y, d2mv.pdf(pos))


