- 分散、平方和、総当たり variance, total sum of squares, pair-wise
- 分散は全要素のペアワイズな違いの足し合わせの指標 variance is an index of sum of pairwise difference of all elements
n <- 100
x <- rnorm(n)
m1 <- matrix(0,n,n)
for(i in 1:n){
for(j in 1:n){
m1[i,j] <- x[i]-x[j]
}
}
m2 <- outer(x,x,"-")
m1 == m2
prod(m1==m2)
range(m1-m2)
sum(abs(m1-m2))
sum((m1-m2)^2)
m3 <- as.matrix(dist(x))
range(m1)
range(m3)
range(abs(m1)-m3)
image(m3)
M <- matrix(1:9,3,3)
t(M)
M + t(M)
M2 <- M + t(M)
M2 - t(M2)
range(m3-t(m3))
sum(m3^2)
sum(m3^2)/2
sum(m3^2)/2/n
sum((x-mean(x))^2)
sum((x-mean(x))^2)/n
var(x)
var(x)*(n-1)/n
sum((x-mean(x))^2)/n
- 全体・群内・群間 all/intra-group/inter-group
d <- 2
n1 <- 30
x1 <- rnorm(n1,1)
n2 <- 20
x2 <- rnorm(n2,5)
X <- c(x1,x2)
m1 <- outer(x1,x1,"-")
m2 <- outer(x2,x2,"-")
M <- outer(X,X,"-")
m12 <- outer(x1,x2,"-")
m21 <- outer(x2,x1,"-")
dim(m1)
dim(m2)
dim(M)
dim(m12)
dim(m21)
length(m1)
length(m2)
length(M)
length(m12)
length(m21)
length(m1)+length(m2)+length(m12)+length(m21)
length(M)
sum(m1^2)+sum(m2^2)+sum(m12^2)+sum(m21^2)
sum(M^2)
sum(m1^2)+sum(m2^2)
sum(m12^2)+sum(m21^2)
sum(M^2)-(sum(m1^2)+sum(m2^2))
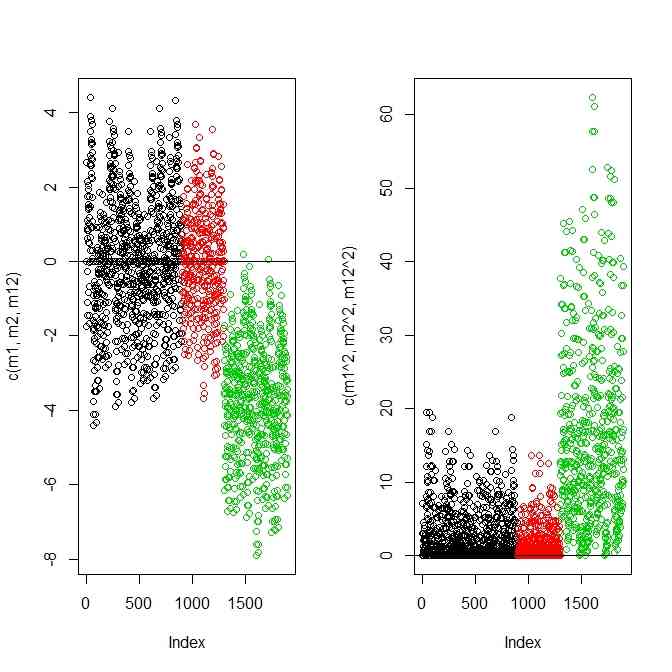
- 群内・群間のばらつきの指標と群の違い indices of inter/intra variations and "difference of groups"

par(mfcol=c(1,2))
plot(c(m1,m2,m12),col=c(rep(1,length(m1)),rep(2,length(m2)),rep(3,length(m12))))
abline(h=0)
plot(c(m1^2,m2^2,m12^2),col=c(rep(1,length(m1)),rep(2,length(m2)),rep(3,length(m12))))
abline(h=0)
par(mfcol=c(1,1))
n1 <- 30
x1 <- rnorm(n1,1)
n2 <- 20
x2 <- rnorm(n2,1)
m1 <- outer(x1,x1,"-")
m2 <- outer(x2,x2,"-")
m12 <- outer(x1,x2,"-")
par(mfcol=c(1,2))
plot(c(m1,m2,m12),col=c(rep(1,length(m1)),rep(2,length(m2)),rep(3,length(m12))))
abline(h=0)
plot(c(m1^2,m2^2,m12^2),col=c(rep(1,length(m1)),rep(2,length(m2)),rep(3,length(m12))))
abline(h=0)
par(mfcol=c(1,1))
- 群内のサンプルの値のばらつきと群間のサンプルの値のばらつきとに分けて考えると群の違いが見えてくるらしい separation of variations into intra-components and inter-components seems to tell something on the difference between (among) groups.
- 検定としてうまくいくためには、帰無仮説を仮定したときの珍しさをp値で表せるように、統計量とそれのp値化するための分布とが必要 When we use this idea as a statistical test, we need a statistics measuring rarity under the null hypothesis and a distribution which converts the statistics into p-value.
- それがF統計量とF分布(Wiki)
n1 <- 30
x1 <- rnorm(n1,1)
n2 <- 20
x2 <- rnorm(n2,2)
X <- c(x1,x2)
m1 <- outer(x1,x1,"-")
m2 <- outer(x2,x2,"-")
M <- outer(X,X,"-")
m12 <- outer(x1,x2,"-")
m21 <- outer(x2,x1,"-")
X <- c(x1,x2)
Z <- factor(c(rep("A",n1),rep("B",n2)))
anova(lm(X~Z))
> anova(lm(X~Z))
Analysis of Variance Table

Response: X
          Df Sum Sq Mean Sq F value    Pr(>F)
Z          1 11.800 11.7999  13.654 0.0005631 ***
Residuals 48 41.482  0.8642
---
Signif. codes:  0 ‘***’ 0.001 ‘**’ 0.01 ‘*’ 0.05 ‘.’ 0.1 ‘ ’
- F value and Pr(>F)が「何か」だろう You can see "F value" and "Pr(>F)" and they must be something
help(df)
pf(13.654,1,48)
1-pf(13.654,1,48)
pf(13.654,1,48,lower.tail=FALSE)
> pf(13.654,1,48)
[1] 0.9994369
> 1-pf(13.654,1,48)
[1] 0.0005630661
> pf(13.654,1,48,lower.tail=FALSE)
[1] 0.0005630661
- ここまででANOVAの出力のDf,F value Pr(>F)の関係は分かった We understood relation among Df, F value, and Pr(>F) already.
- ANOVAのp値はF統計量と二つの自由度で決まる p-value of ANOVA is determined by F statistics and two DFs.
sum(m1^2)/2/n1 + sum(m2^2)/2/n2
sum(M^2)/2/(n1+n2) - (sum(m1^2)/2/n1 + sum(m2^2)/2/n2)
> sum(m1^2)/2/n1 + sum(m2^2)/2/n2
[1] 41.482
> sum(M^2)/2/(n1+n2) - (sum(m1^2)/2/n1 + sum(m2^2)/2/n2)
[1] 11.800
- 出力のSum Sqの計算法もわかった We now know Sum Sq in the output
S.intra <- sum(m1^2)/2/n1 + sum(m2^2)/2/n2
S.inter <- sum(M^2)/2/(n1+n2) - (sum(m1^2)/2/n1 + sum(m2^2)/2/n2)
S.intra/48
S.inter/1
- 出力のMean Sqもわかった We know Mean Sq in the output
M.inter <- S.inter/1
M.intra <- S.intra/48
M.inter/M.intra
- 出力のF valueがわかった。群間のばらつきと群内のばらつきの比。We know F value, which is a ratio of degree of variations between inter and intra.
- 2つのDfは、群の数-1、(総サンプル数-1)-(群の数-1) Two DFs are (number of groups -1) and (\(total number of samples -1\) - (number of groups-1))
- 全体の自由度はサンプル数-1、なぜなら、全サンプルの平均値は標本から求めたものを使っていて、そのように「前提としている値」が1つあるから DF in the whole is (number of samples -1), because we use the mean of the whole for the evaluation from sample data.
- そのDFをを群間と群内にふりわけてある The DF should be divided into inter and intra.
