- 昨日の記事で「みんなで決める」というテーマを書いた
- ここで「みんなで決める」というのは、「袂を分かつ」ことなく、みんなで一塊でいることを想定していた
- 離散的な状況で次のような状況設定にして、「みんなで一塊で進む」ための条件について考えてみる
- 空間は1次元格子
- 一方向性の分布の変化を考える
- 時間は離散
- 空間座標0に集中した分布を時刻0の状態とする
- 時刻
 、位置
、位置 における滞留率
 を定め、時刻
 、位置
、位置 にあった要素は、時刻
 には
には の割合で位置
 にとどまり、
 の割合で位置
 に進むものとする
 と
と によらず一定のとき

t.max <- 50
x.max <- t.max
z <- matrix(0,t.max+1,x.max+1)
z[1,1] <- 1
p0 <- 0.5
p <- matrix(p0,t.max,x.max)
for(i in 1:t.max){
z[i+1,1:x.max] <- z[i,1:x.max] * p[i,1:x.max]
z[i+1,2:(x.max+1)] <- z[i+1,2:(x.max+1)] + z[i,1:x.max] * (1-p[i,1:x.max])
}
matplot(t(z),type="l")
z2 <- z
for(i in 2:(t.max+1)){
z2[i,1:i] <- dbinom(0:(i-1),i-1,prob=p0)
}
range(z-z2)

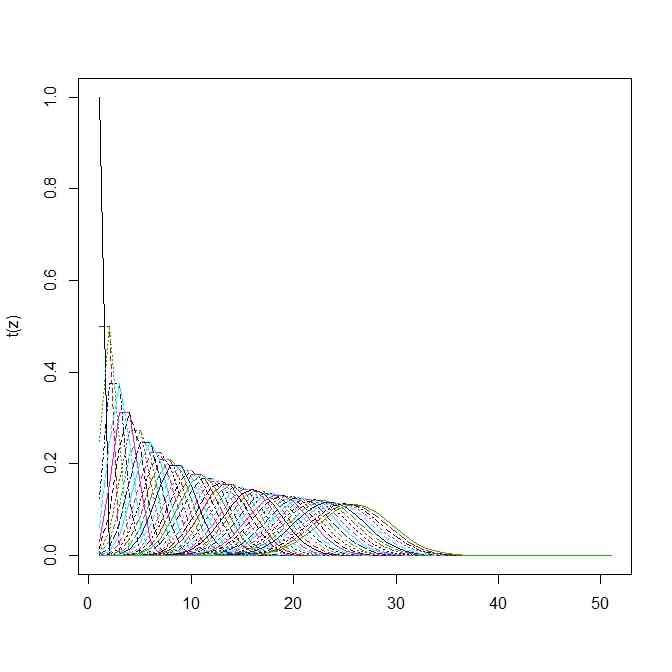
p <- matrix(rep(sort(runif(x.max)),t.max),byrow=TRUE,t.max,x.max)

for(i in 1:t.max){
	z[i+1,1:x.max] <- z[i,1:x.max] * p[i,1:x.max]
	z[i+1,2:(x.max+1)] <- z[i+1,2:(x.max+1)] + z[i,1:x.max] * (1-p[i,1:x.max])
}

matplot(t(z),type="l")
- ある
 の決める直線に関して滞留率に差を作ると2峰性になる

t.max <- 50
x.max <- t.max

z <- matrix(0,t.max+1,x.max+1)
z[1,1] <- 1

p <- matrix(0,t.max,x.max)
p[1,1] <- 0.5
pmid <- 0.6
p0 <- 0.7
p1 <- 0.55
k <- 0.4
for(i in 2:(t.max)){
	tmp.i <- round(i*k)
	p[i,which(1:x.max < tmp.i)] <- p0
	p[i,which(1:x.max == tmp.i)] <- pmid
	p[i,which(1:x.max > tmp.i)] <- p1
}


for(i in 1:t.max){
	z[i+1,1:x.max] <- z[i,1:x.max] * p[i,1:x.max]
	z[i+1,2:(x.max+1)] <- z[i+1,2:(x.max+1)] + z[i,1:x.max] * (1-p[i,1:x.max])
}

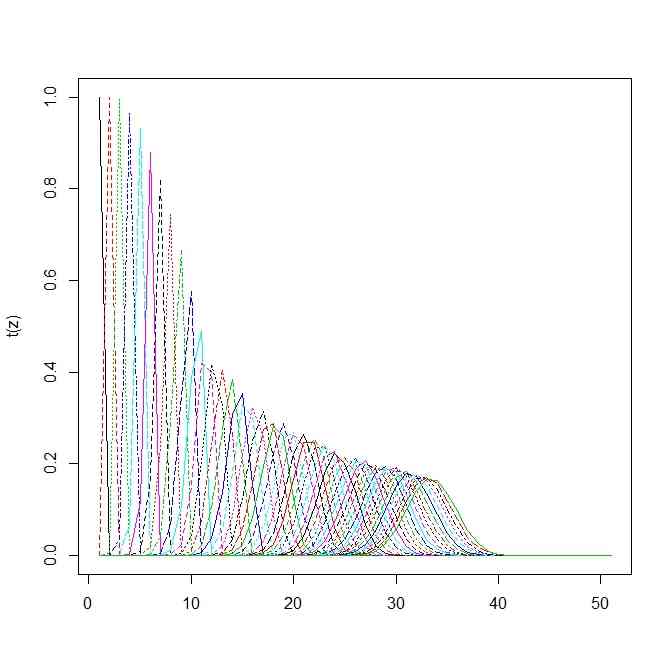
matplot(t(z),type="l")

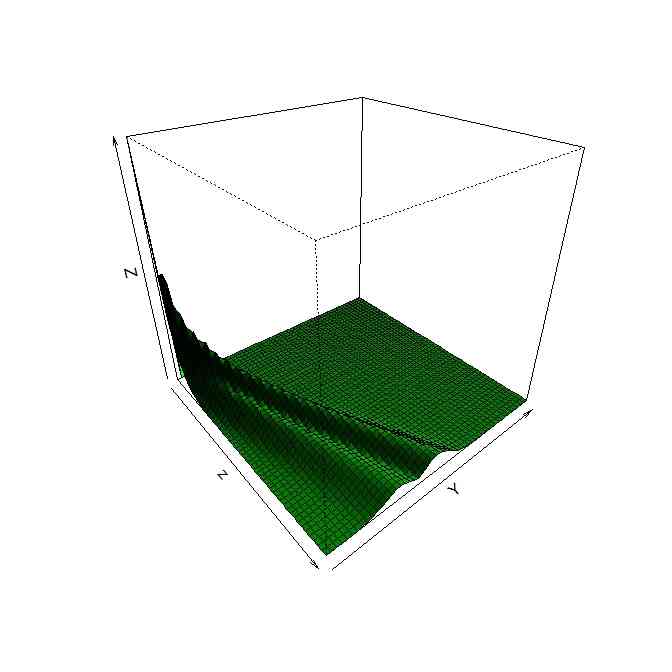
persp(z,phi=30,theta=50,shade=TRUE,col="green")
t.max <- 50
x.max <- t.max

z <- matrix(0,t.max+1,x.max+1)
z[1,1] <- 1

p <- matrix(0,t.max,x.max)
p[1,1] <- 0.5
pmid <- 0.5
p0 <- 1
p1 <- 0
k <- 0.5
r <- 0.5
for(i in 2:(t.max)){
	tmp.i <- ((i)*k)+0.5
	p[i,] <- 0.5 - sign((1:x.max)-tmp.i)*abs( exp(-r*abs((1:x.max)-tmp.i))-1)*0.5
}


for(i in 1:t.max){
	z[i+1,1:x.max] <- z[i,1:x.max] * p[i,1:x.max]
	z[i+1,2:(x.max+1)] <- z[i+1,2:(x.max+1)] + z[i,1:x.max] * (1-p[i,1:x.max])
}

matplot(t(z),type="l")
matplot(t(p),type="l")

persp(z,phi=10,theta=110,shade=TRUE,col="green")
、位置
における滞留率
を定め、時刻
、位置
にあった要素は、時刻
には
の割合で位置
にとどまり、
の割合で位置
に進むものとする
と
によらず一定のとき
の決める直線に関して滞留率に差を作ると2峰性になる


