npt <- 1000
x <- sort(rnorm(npt))
y <- sort(runif(npt,-10,10))
x <- x-mean(x)
y <- y-mean(y)
y[which(abs(x)<0.5)]<-sort(rnorm(length(which(abs(x)<0.5)),sd=0.2))
plot(x,y)
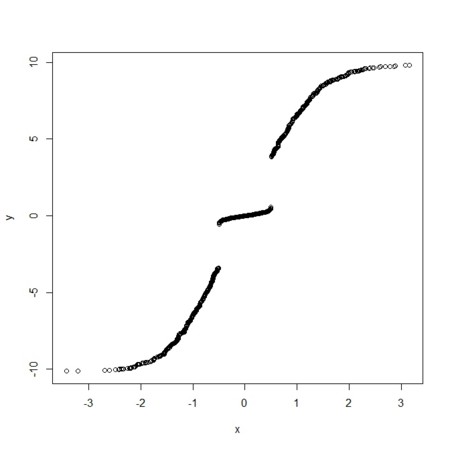
- この観測曲線の原点での傾きについて考えたいのだが、場合によっては、原点での傾きは0かもしれないし、無限大かもしれないという
- 0やら無限大やらは、ちょっと扱いが面倒くさいので、
 なる行列を使って傾き0は傾き
 に、傾き無限大は傾き
 になるように変換する(x軸単位ベクトル(1,0)、y軸単位ベクトルをそれぞれ(
 )、(
)、( )にする線形変換)
t<-pi/6
M <- matrix(c(cos(t),cos(pi/2-t),sin(t),sin(pi/2-t)),byrow=TRUE,2,2)
X <- matrix(c(x,y),byrow=TRUE,nrow=2)
new.X <- t(M%*%X)
plot(new.X)
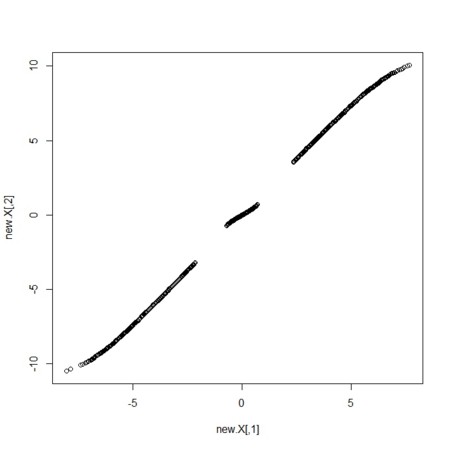
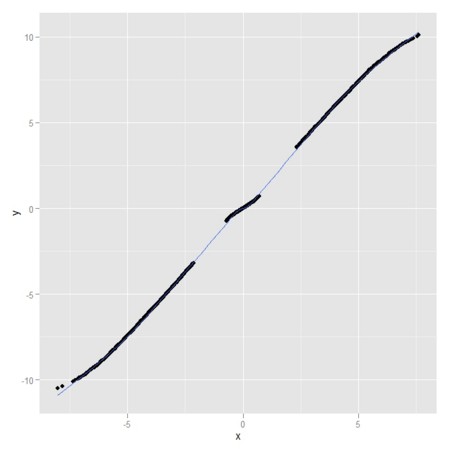
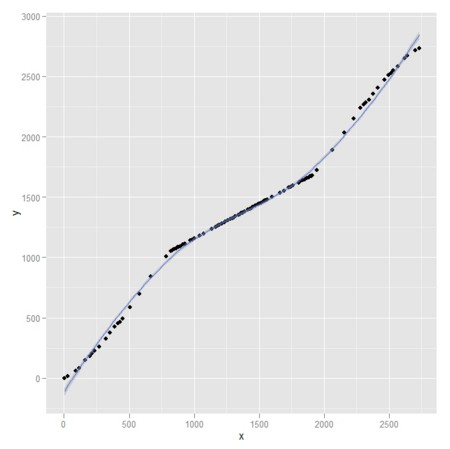
- ここにggplot2パッケージでsmoothing線を引いてみよう
library(ggplot2)
my.df <- data.frame(x=new.X[,1],y=new.X[,2])
gp <- ggplot(data = my.df,aes(x=x,y=y))
gp <- gp + geom_point() + stat_smooth()
gp
なる行列を使って傾き0は傾き
に、傾き無限大は傾き
になるように変換する(x軸単位ベクトル(1,0)、y軸単位ベクトルをそれぞれ(
)、(
)にする線形変換)


